
July 7, 2021, by Faraz Khan
Better OCR of Research Papers and Newspaper Articles
Optical Character Recognition (OCR) describes a technique whereby computers can read printed text.
OCR of newspapers, magazines and research papers has always been challenging due to the unconventional and unusual formatting of the material. Text boxes, images and tables are often overlaid and are difficult (for a computer) to distinguish. Conventional, out-of-the-box OCR software is usually not able to identify such formatting, and therefore produces unreliable results. The challenge lies in confidently identifying the text regions and separating these from the overlaid image and table regions.
Fortunately, we now have computer vision models that have been trained on such datasets and can identify all the various regions within research papers, newspapers and magazines. In this blog post, I will demonstrate how to use these computer vision tools to perform OCR on challenging input documents. An intermediate level of Python programming language is needed to implement these models.
The frameworks used here to perform the detection and OCR are:
- Detectron2
- Layout Parser
- Pytorch
- Tesseract
- PDF2Image (to read the pdf documents directly as PIL Images)
If you would like to see the generated results along and code used to generate these, please visit this SharePoint page.
OCR of a Research Paper
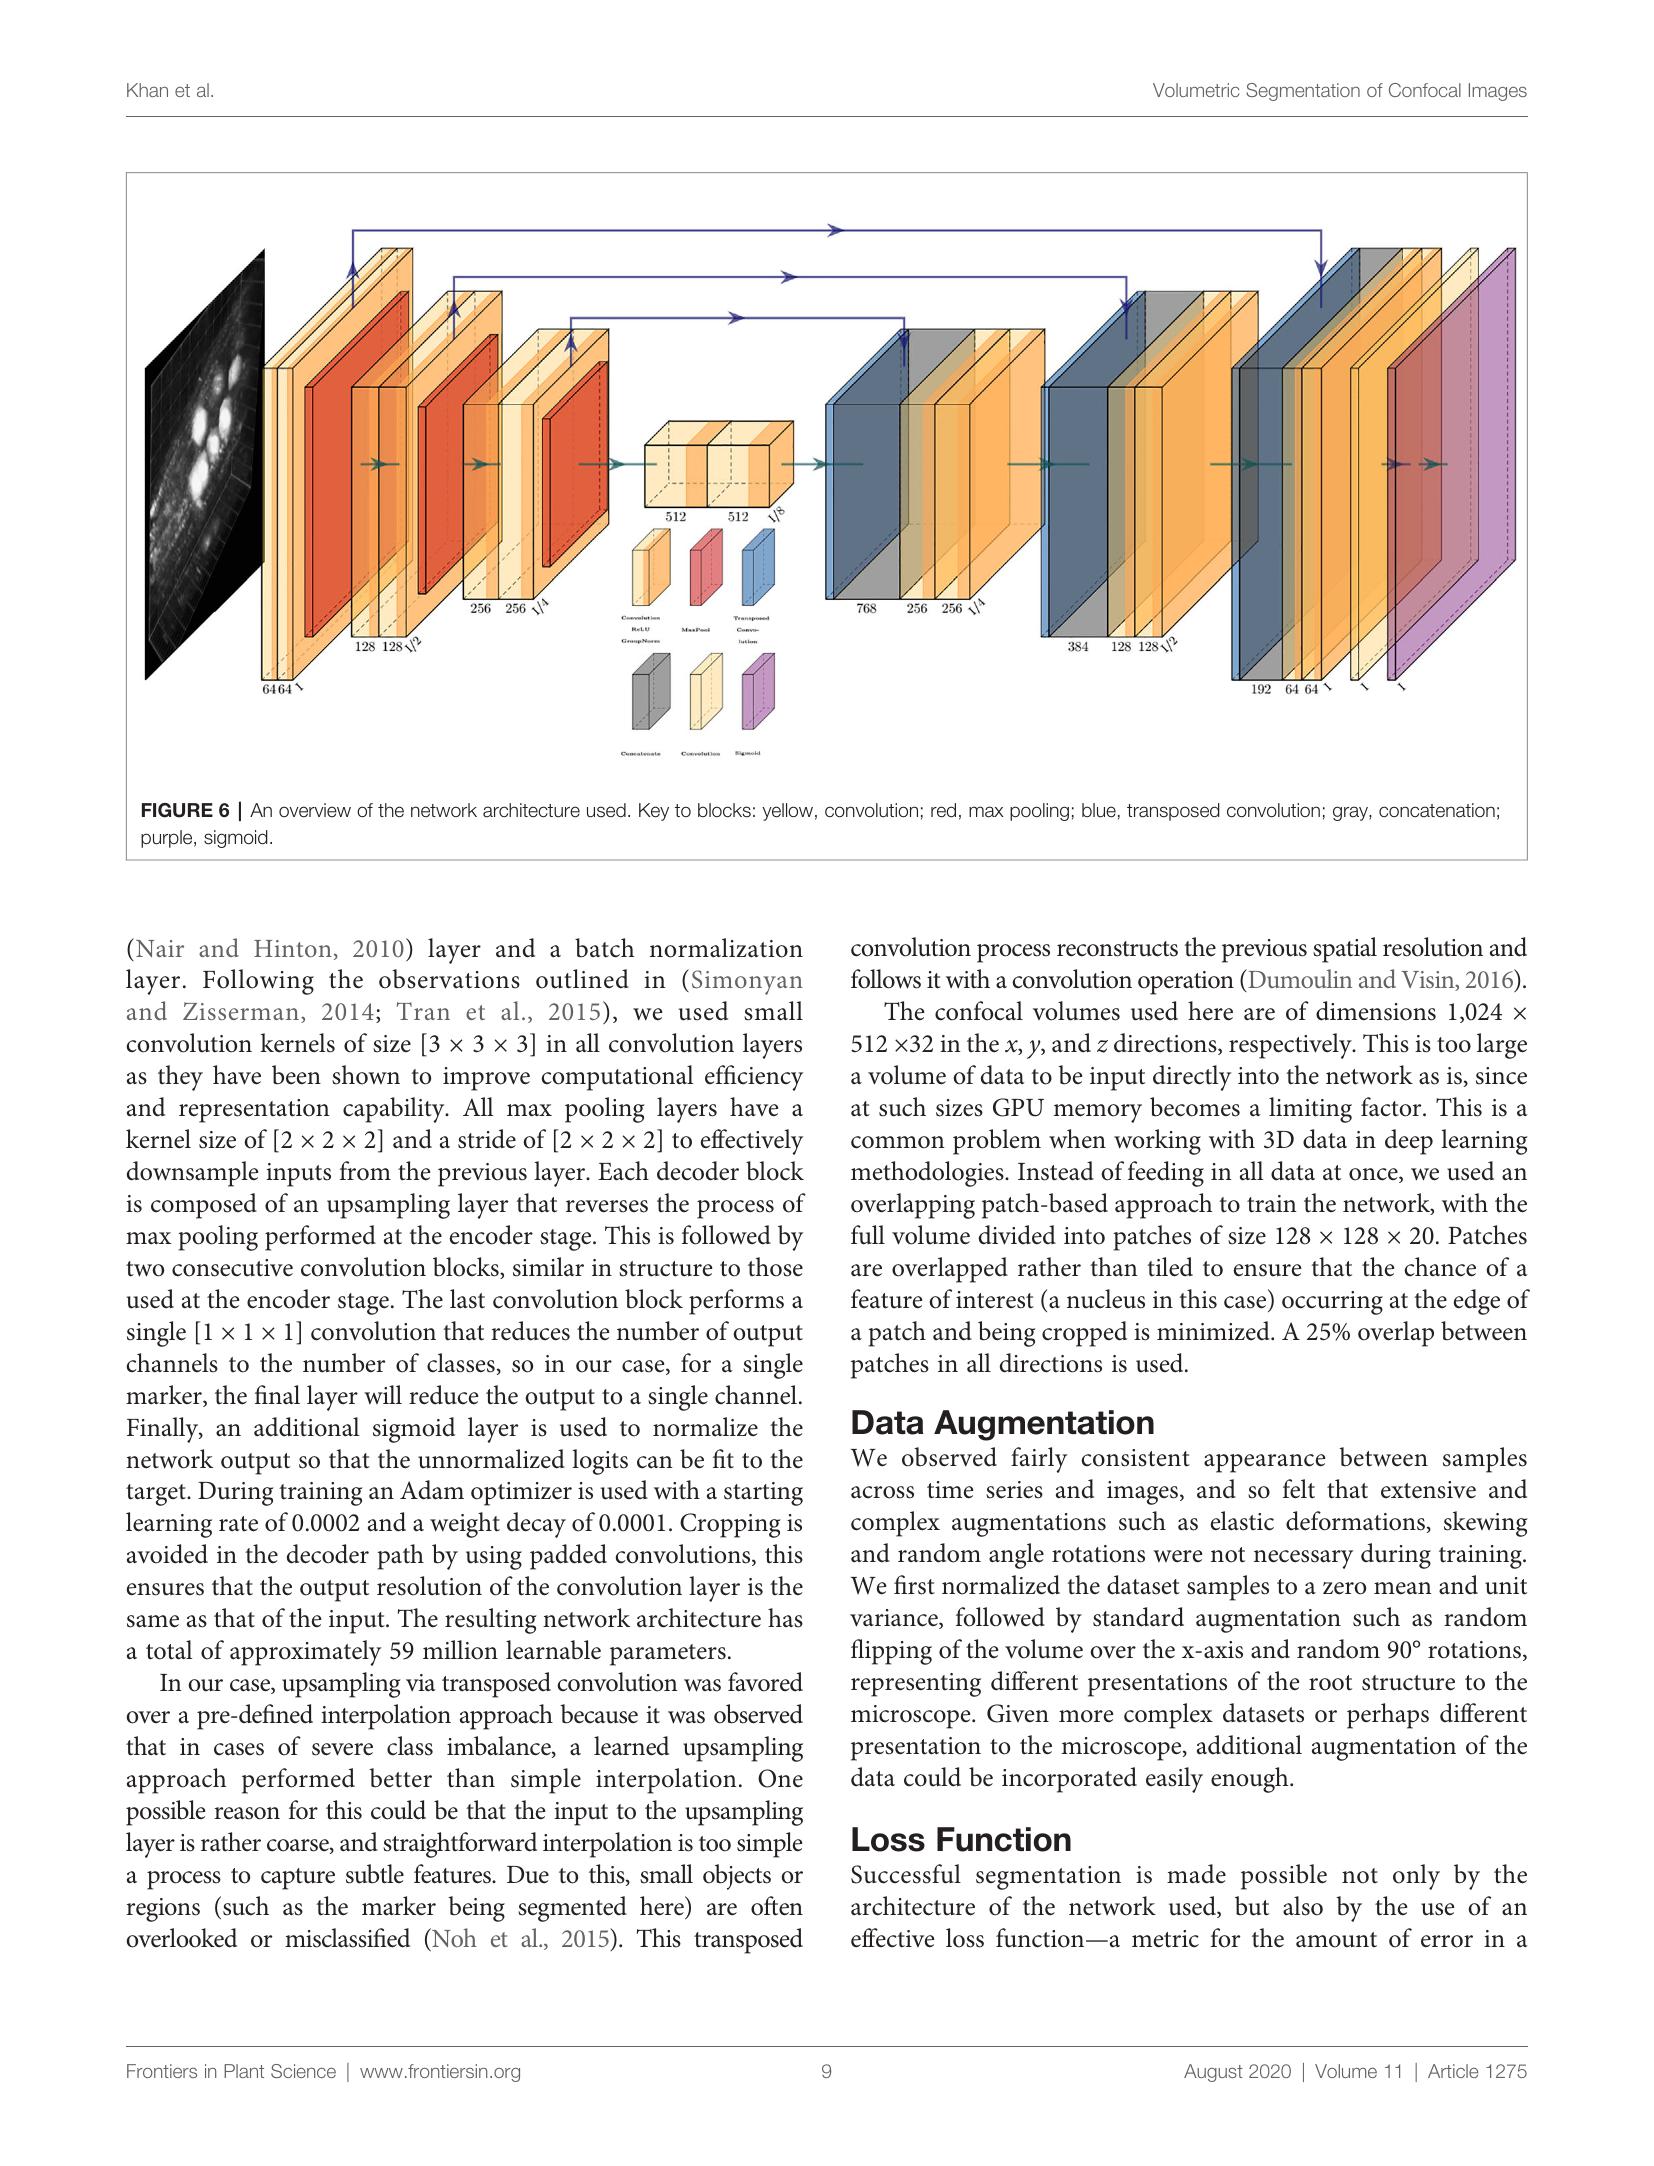
To demonstrate the OCR of a research paper, consider the following page. It consists of an image that spans both columns and text is written in two columns. The challenge here is to identify the text regions and the figure region, separate the text regions and isolate them in sort-order for the OCR library.
Layout Parser has a number of pre-trained models that can be downloaded and loaded as per your use case. The model catalogue along with their respective label maps can be seen listed here: Layout-Parser Model Catalog
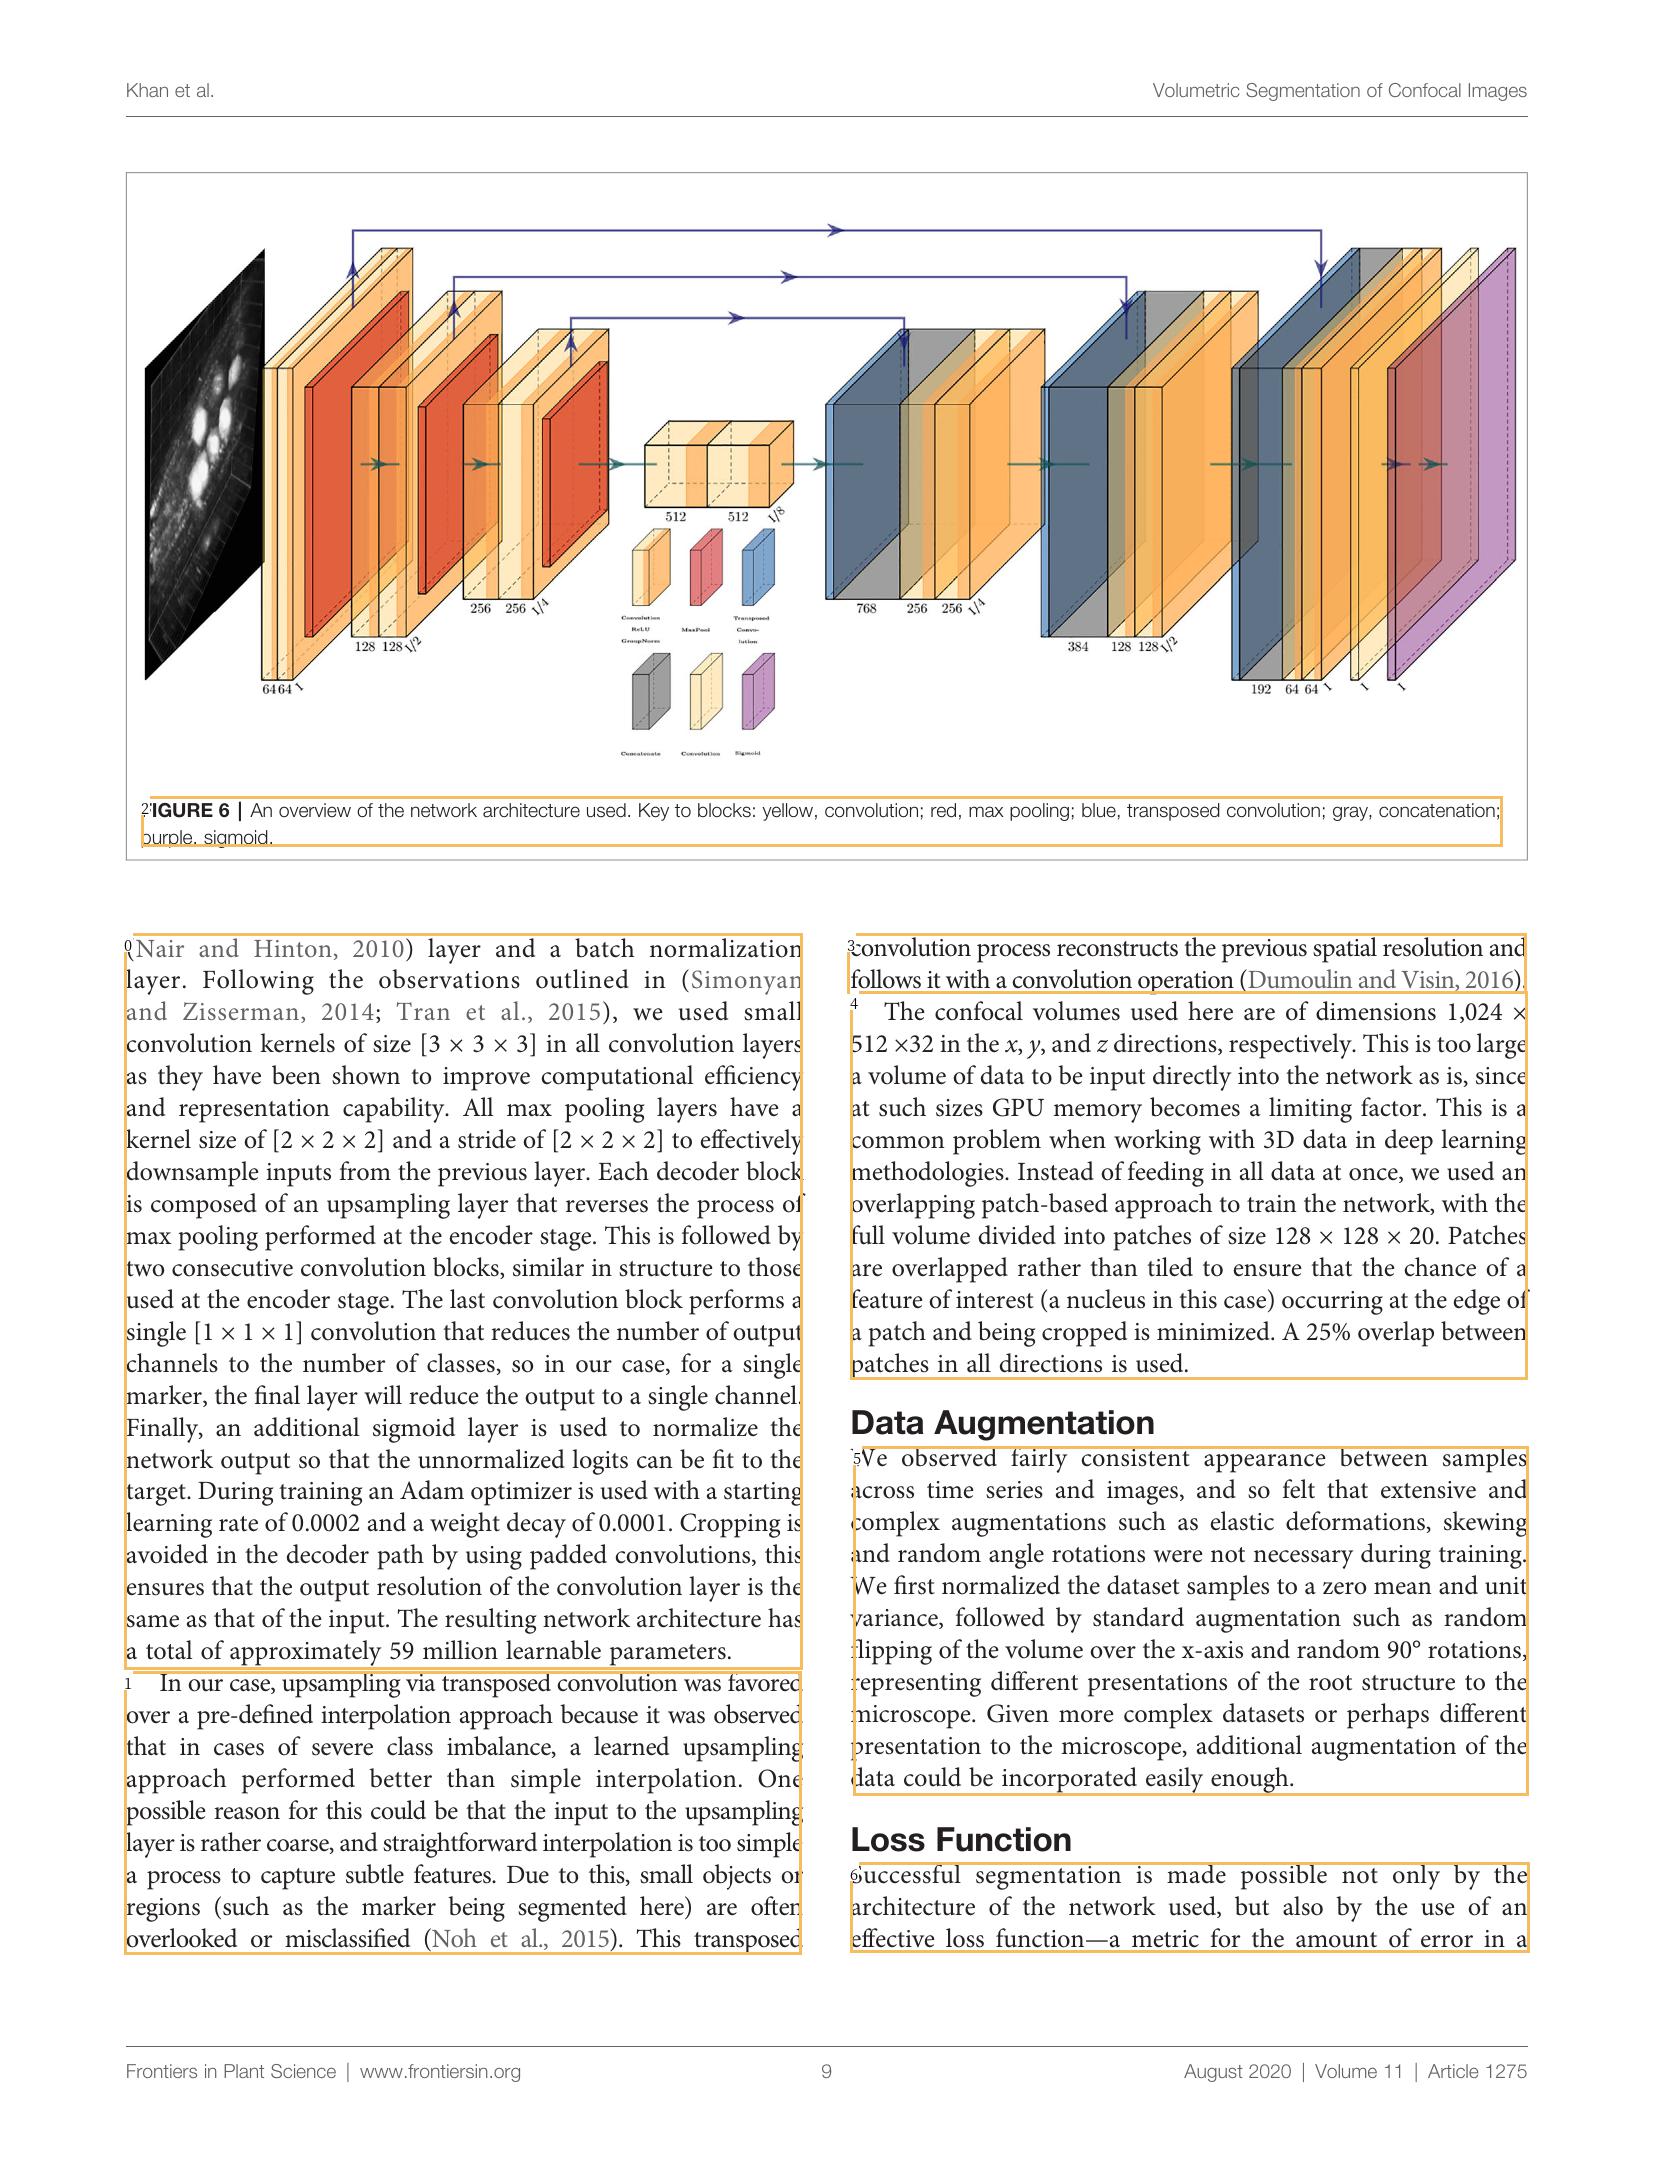
Since we have a research paper, the model to load in would be “PubLayNet/faster_rcnn_R_50_FPN_3x”. Loading up the model and asking layout parser to detect the image layout using the following labelmap: {0: “Text”, 1: “Title”, 2: “List”, 3:”Table”, 4:”Figure”}, produces the following output:

The provided labelmap are the regions we want to identify. And as can be seen from the generated image above, the model was able to identify the textbox, title and figure regions. The model can now easily filter out the text regions and, based on the coordinates of each text box, we can sort the text regions also. You can see this in the image below (click on the image to open a zoomed view and see the sorted regions):
Tesseract OCR can then be called upon to perform OCR on the detected text regions.
The generated OCR from the above text boxes can be seen on our SharePoint page: https://uniofnottm.sharepoint.com/sites/DigitalResearch/SitePages/Better-OCR-of-Research-Papers-and-Newspaper-Articles.aspx
OCR of Newspapers/Magazines
Magazines and newspapers often prove to be more challenging than research papers for OCR software. To demonstrate the OCR of a more difficult input, consider the following page from the NUBS 2011 magazine
Since this is a different layout entirely, a different model will be used to detect the layout. The model used here is “PrimaLayout/mask_rcnn_R_50_FPN_3x” with the label map: {1:”TextRegion”, 2:”ImageRegion”, 3:”TableRegion”, 4:”MathsRegion”, 5:”SeparatorRegion”, 6:”OtherRegion”}. The detected output can be seen below:

The layout-parser was able to identify all of the regions requested in the label map. From this output we can filter the text box regions and sort them using their coordinates for OCR:

The result is a clean, machine-readable text ready for further analysis. This might include categorisation, keyword searches, or various natural language processing methods.
If you would like to replicate these results or use these tools in your research, you can find the code used to generate the above results here: https://uniofnottm.sharepoint.com/sites/DigitalResearch/SitePages/Better-OCR-of-Research-Papers-and-Newspaper-Articles.aspx
Sorry, comments are closed!