May 8, 2018, by Raphael Velt
DRHack: The results of our Digital Research Hackathon
On the afternoon of Friday 27 April, at the same time as the Digital Research Week’s closing ceremony, DRHack kicked off. We co-hosted this event with HackSoc, a student society dedicated to hacking. We invited students to come and try their hand at designing and creating new ways of engaging with research data. Hackathon participants had until Saturday afternoon to create something, with a few staying in the Computer Science building overnight.
The data sets
We published a call for data sets, to get researchers across the University to bring in challenges. We got 5 responses, and added a few other data sets. The data sets were the following:
- Professor Andrew Leyshon and Dr Shaun French from the School of Geography offered us a list of bank and building society branches in Britain, alongside with their postcode. The data set covered years between 2003 and 2012, and was used to publish a study of bank closures, and understand which communities face financial exclusion.
- Professor Todd Landman from Social Sciences volunteered the data set behind the Human Rights Atlas. This rich data set shows 200+ socio-political indicators for 200+ over 30 years. This data set is freely available from the UK Data Service.
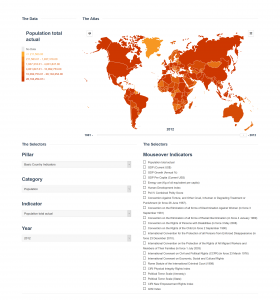
The Human Rights Atlas
- Professor Olympia Bekou from the School of Law offered data around Cooperation and Judicial Assistance between countries.
- Dr Priya Ramakrishna from the School of Biosciences submitted a data set around the ionomes of Arabidopsis plants. Arabidopsis, a weed related to mustard and cabbage, is know as the “lab rat” of plant research and is used as a model species to understant plant biology. This data set shows the concentration of various minerals (in ionic form, hence “ionome”) given a set of planting and growing conditions.
- Professor Sandesh Sivakumaran from the School of Law offered a data set describing the recommendations from the Universal Periodic Review. This mechanism, led by the United Nations, assesses the state of Human Rights in countries around the world.
- We also attracted the attention of DRHack participants to other open data sets contributed by researchers at the University of Nottingham, in two repositories:
- The University’s own Nottingham Research Data Repository, containing mostly data sets from research funded by the Engineering and Physical Sciences Research Council (EPSRC)
- The UK Data Archive, sponsored by the Economic and Social Research Council (ESRC)
- Finally, we provided an export from the ePrints database, managed by the University Libraries. This repository contains 12,000 research articles from all faculties, as depositing published articles has been mandatory since 2016.
Aaron Osher’s Ionomics Graph
Toby Jones’ Global Eye Dashboard
A visualisation of paper lengths
The results
Aaron Osher’s Ionomics Graph
Toby Jones’ Global Eye Dashboard
A visualisation of paper lengths
4 teams have submitted their “hacks” on Saturday afternoon, and presented them to a jury comprising members of the Digital Research Team and of the general public. The jury awarded 4 prizes:
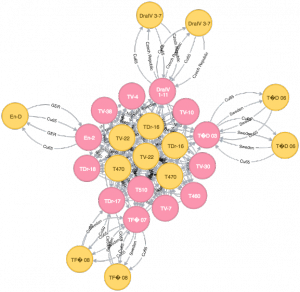
- Joint 3rd place: Aaron Osher, who loaded the ionomics data set into Neo4J, a graph database, which can be used to query similarities between data points, and showcased examples of queries based on similar ionomes or on similar geographical locations.
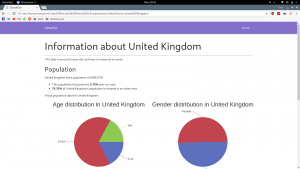
- Joint 3rd place: Toby Jones, who created a web interface for presenting the data from the Human Rights Atlas in the form of country dashboards. Both 3rd place winners received £20 in Amazon vouchers.
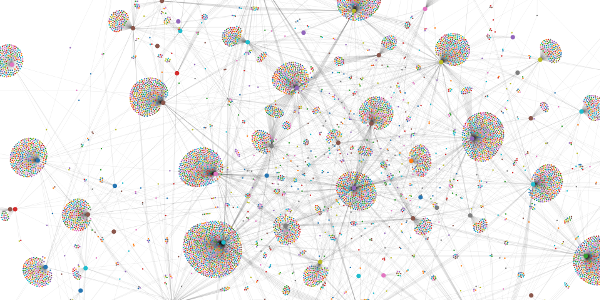
- 2nd place: Pedro Santos Mendonça, who also used Neo4j, this time to visualize the ePrints database. The outcome is a graph where research papers are linked to the divisions and schools that have contributed them. The graph shows which schools collaborate with each other and works as a “map” of scientific research done at our University – similar to other maps (here and here) produced at a global level. Pedro received a Raspberry Pi 3 for his contribution.
- 1st place: Team “Don’t forget to feed your NeoPets” (Hassan Al-Ubeidi and Vikram Chhapwale). This team also worked on the ePrints data set, and produced two highly original contributions. First, they used Machine Learning methods to produce a tool that, given the abstract of an article, predicts which publisher should be associated with it. Secondly, they produced a visualization showing how the lengths of articles are distributed. Both team members received a Google Home Mini.
No comments yet, fill out a comment to be the first
Leave a Reply