« return to post
Figure1
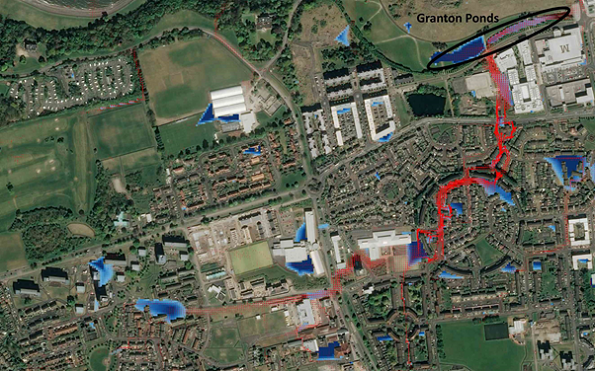
Figure 1 CityCat Simulation of the Granton Ponds for a short duration extreme event. Water depths are shown in blue and velocity vectors in red (© Google maps)
Figure 1 CityCat Simulation of the Granton Ponds for a short duration extreme event. Water depths are shown in blue and velocity vectors in red (© Google maps)