« return to post
Polarities
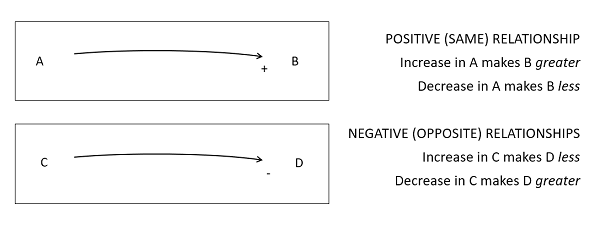
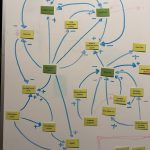
Figure 4. Explaining positive and negative relationships in causal loop diagrams
Figure 4. Explaining positive and negative relationships in causal loop diagrams