« return to post
Variables2
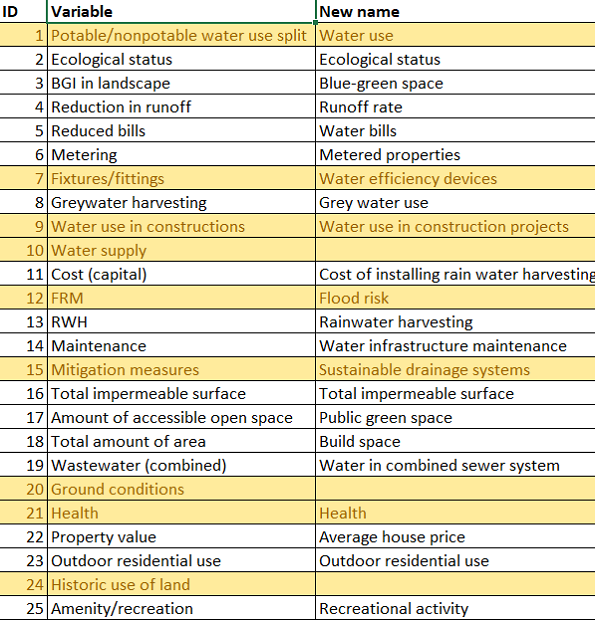
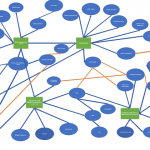
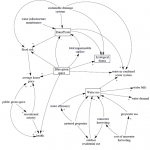
Figure 3. A streamlined set of variables
Figure 3. A streamlined set of variables
Figure 3. A streamlined set of variables
Figure 3. A streamlined set of variables