« return to post
CLD2
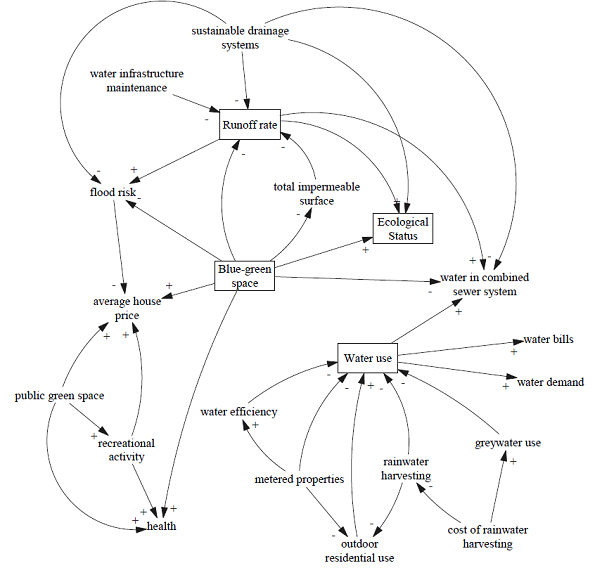
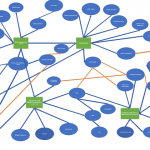
Figure 6. Causal loop diagram produced by Vensim software
Figure 6. Causal loop diagram produced by Vensim software