November 19, 2014, by Blue-Green team
Piloting Bayesian Networks as a technique for the participatory modelling of flood risk in Hebden Bridge, West Yorkshire: Part II
Part II: Using the model – the final three workshops
A project has been underway in Hebden Bridge, West Yorkshire to develop and pilot a methodology to involve stakeholders in modelling flood risk to their local catchment, and embed their local knowledge and understanding into flood risk management. The project, which is now coming to an end, consisted of a series of six participatory workshops, flanked by pre- and post-project interviews. The preliminary work and the first three workshops formed part one of this blog, and can be viewed here. This second part starts from where we left off, chronicling workshops four through six, and presenting some preliminary findings from testing model using four scenarios.
Workshop four
Prior to workshop four, the model structure developed in workshop three was taken to the Environment Agency in Leeds, to be streamlined by experts in regional flood risk. This ‘behind the scenes’ work was communicated to the stakeholder group by e-bulletin. The main purpose of this work was to choose two states (the current state, and the alternative state) for each variable in the network. A state is a possible condition that a [variable] can take. For example [public awareness of flood warnings] could have states good and poor. Educating the public about flood warnings, for example by leaflet dropping, would make it more likely that awareness would shift towards the good state.
We may have evidence a variable is in a particular state, but most of the time there is uncertainty around exactly which state the variables are in. In this situation we attach a probability to each of them. In the example above, current [public awareness of flood warnings] could be 20% good and 80% poor. The intervention of leafleting, described above, could shift these to 40% good and 60% poor. The magnitude of the changes that we observe across the network when we make certain interventions ‘live’ in Bayesian networks can then used to make policy recommendations and/or decisions. Given two states for each variable, workshop four got stakeholders to systematically work through each variable, looking at it in isolation. An example is given below:
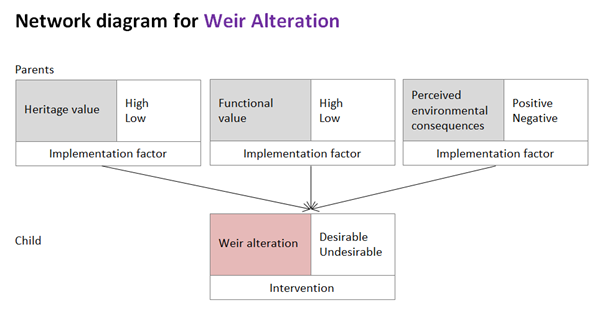
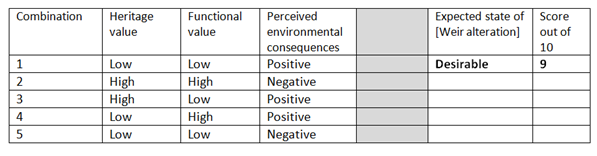
In this example we can see how the desirability of the intervention [weir alteration] is affected by three factors. In Bayesian networks parlance we call these ‘parents’, as the network resembles a family tree. The variable [weir alteration] has two states, desirable and undesirable. The probability of the variable taking each of these states will vary according to the states of its parents. Stakeholders were asked to imagine different scenarios and comment on which state they would expect the variable weir alteration to be in ‘more often than not’, and then to say how many times out of ten, they would expect the variable to take this state. The table below is an example of that presented to stakeholders to complete at workshop four. Each line represents a scenario to be considered, the first of which has been completed (in bold type).
Working in small groups this process was repeated until all of the relationships in the network had been quantified. The results from this exercise produced a series of probabilities that could then be translated into conditional probability tables. These are the probability distributions which underlie each variable in a Bayesian network, and required for the model to work.
Workshop five
Netica™ was chosen as the software in which to construct the group network, and was first presented to the modelling group in workshop five. After watching video tutorials, stakeholders were asked to complete a series of simple practical activities within the software package to familiarise themselves with it, and reduce any wariness. The last of these activities was designed as such, that it got stakeholders to sensitivity test the model by making predictions as to the effect of each intervention, testing these predictions within the modelling software, and commenting on how far the observed changes matched or differed from their predictions.
Workshop six
At the sixth workshop, stakeholders moved from exploring the effects of individual interventions to combinations of interventions. This was achieved by outlining four future socio-economic scenarios for Hebden Bridge, and discussing the interventions most likely to be implemented under each of those scenarios. These four scenarios were then simulated in the model, with group discussion over the relative impact on different objectives. The four scenarios and the model outputs are illustrated in the figures below:
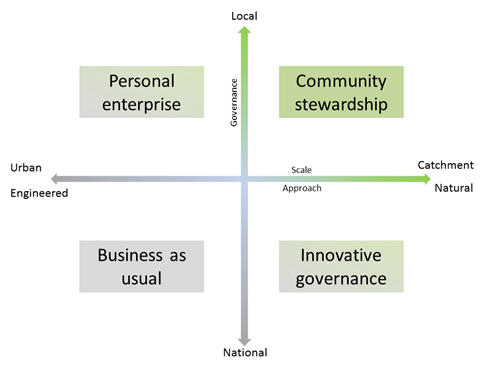
Four future socio-economic scenarios for Hebden Bridge.
1. Business as usual – traditional engineered defences are designed and implemented with minimal public participation.
2. Personal enterprise – flood risk is managed on an individual basis, favouring well-established methods and advice from agencies.
3. Innovative governance – flood risk is governed in a sustainable and natural way (sometimes experimental). Agencies take the lead.
4. Community stewardship – the community drive medium and small-scale changes. Decisions are made by the community
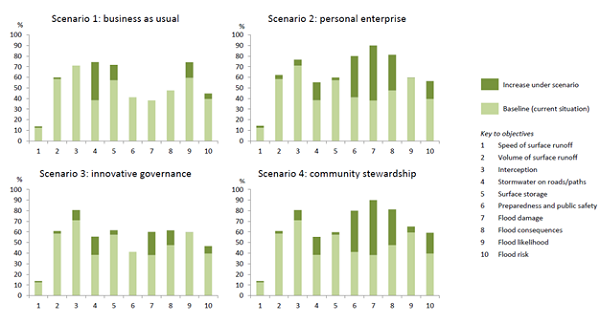
Model outputs from running the four scenarios.
Next time
It was crucial to capture stakeholder views on the value of the process, both in terms of learning lessons for future participatory modelling projects, but also to assess the extent to which social capacity had increased, both within and outside of the modelling group. Social capacity is a combination of ‘civic capacity’, where a reliable public knowledge is created from expertise that was previously held by the privileged few (Jasanoff, 2003), and ‘social learning’, where individual learning is based on observations of, and social interactions with, others within a group (Bandura, 1977).
The next blog in this series will present findings from these post-project stakeholder interviews; sharing their views on the project in their own words.
Blog post by Shaun Maskrey, University of Nottingham.
Read the eBulletins that document Shaun’s research at Hebden Bridge on the Blue-Green Cities website.
No comments yet, fill out a comment to be the first
Leave a Reply