« return to post


PerceptionSurveryResults
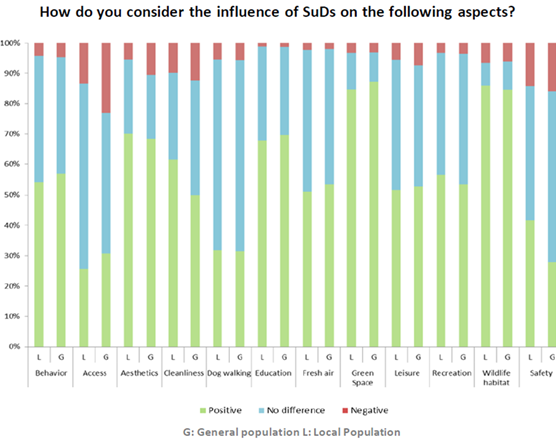
Figure 2. Perceptions of SuDS for a range of factors.
Figure 2. A graph showing survey results looking at the perceptions of SuDS for a range of factors.