« return to post


Diversity Index
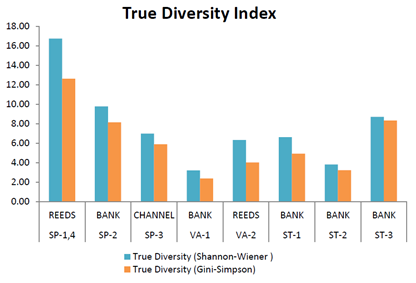
Figure 6. True Diversity Index results for samples taken in the SuDS ponds.
Figure 6. True Diversity Index results for samples taken in the SuDS ponds.