« return to post
SRP over time
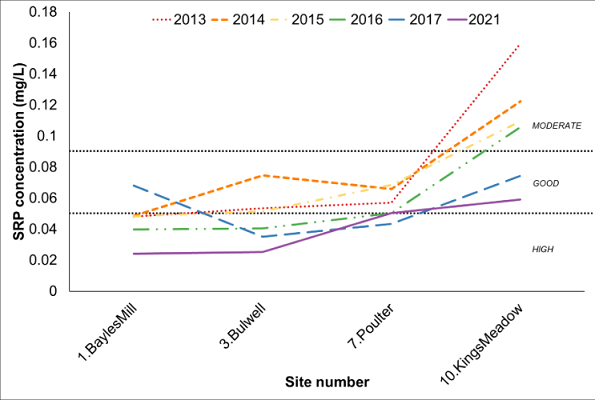
Figure 2. Soluble reactive phosphorus (SRP) concentrations for four sites on the River Leen for sample years 2013 to 2021. 2013-2017 data collected by the EA (2021a) and 2021 data collected during this study. The approximate threshold values between moderate and good, and good and high WFD classification standards are indicated by the black dotted lines.