« return to post
Map
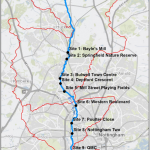
Figure
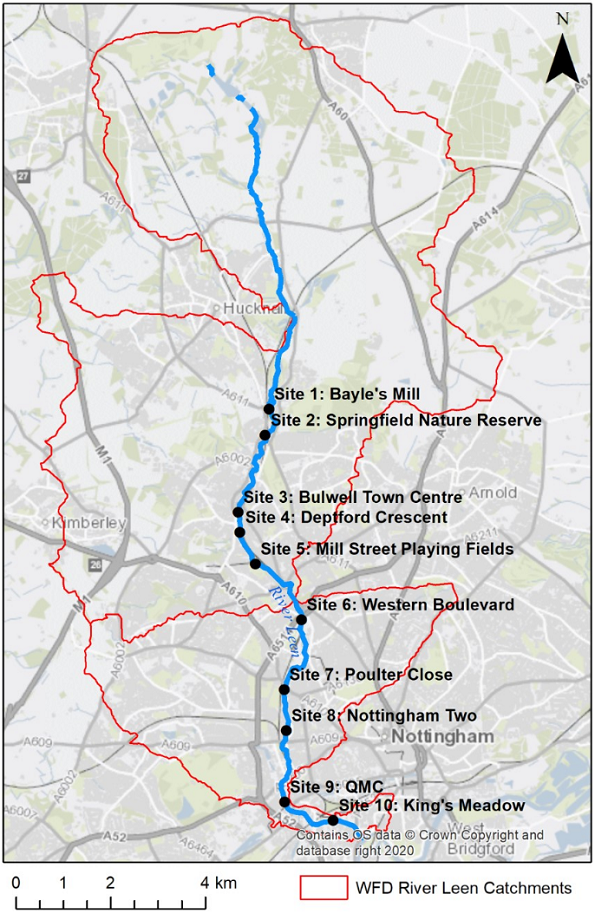
1 : Sites monitored on the River Leen for this study. The red lines delineate the two Water
Framework Directive (2000/60/EC) catchment areas used to classify the ecological status of the
river: the upper catchment from source to Day Brook, and the lower catchment from Day Brook to
the River Trent. Data from EA (2021b) and OS Open Rivers (2021).