September 12, 2018, by Blue-Green team
Using System Dynamics for Sustainable Water Management in Ebbsfleet: Part 2
In a previous blog (System Dynamics Part 1), we gave a presentation of the Ebbsfleet case study, summarised what delivering a System Dynamics model could entail and began the process of developing the model by defining the problem. In this blog post, we will go over the next step, the definition of metrics and variables, while the blog after will document the reiterative process of assembling the causal loop diagram.
As a reminder, we established that ‘Sustainable urban water management’ is the problem to be defined. With the Ebbsfleet stakeholders, we defined the dimensions that constitute the problem and a series of key measures for each problem dimension.
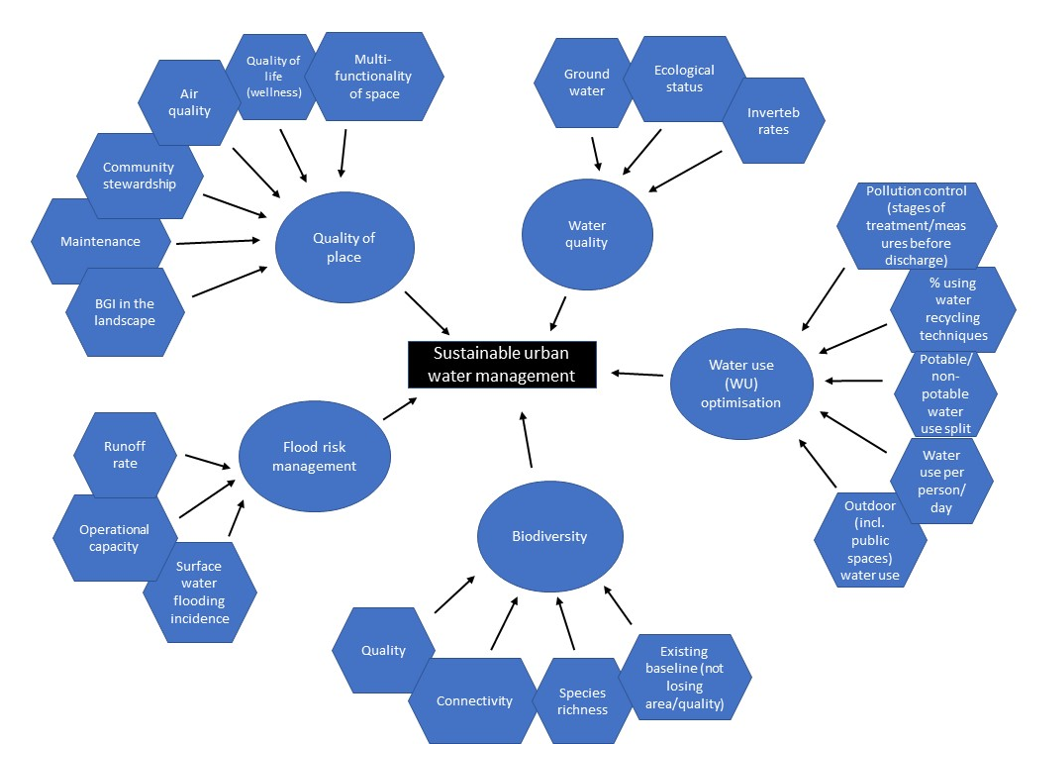
Figure 1: Problem dimensions and key measures adopted by the group
Part 2: Variable identification and causal loop diagram
In the following two workshops, the stakeholders defined the interim list of variables whose behaviour over time defines the problem. This has been done for each of the five problem dimensions. The variables, and the direct causal relationships between them represent the building blocks of the next stage of the model, the causal loop diagram. The direct/indirect causes, direct/indirect effect and drivers of change for each problem dimensions are listed below.
Problem dimension: BIODIVERSITY
- Direct causes: Engineered solutions, construction (disturbance), level of use/pressure, number of users, type of drainage, local policy – local plan restrictions (use of pesticides), connectivity, relevant landscaping for biodiversity, ground conditions, water retention
- Indirect causes: Awareness (public) of functions, appreciation/value of biodiversity, community capacity, expectations of a ‘garden city’, level of management/maintenance, lack of education about benefits of green spaces, high level legislative agenda, house density, regional biodiversity, property values
- Drivers of change: Biodiversity opportunity areas, Dartford plan, urbanisation
- Direct effects: Water cycle, air pollution, urban cooling, noise, variety of habitat, carbon sequestration, connectivity, water quality, property values, noise mitigation, carbon sequestration, water quality, nature of change in maintenance
- Indirect effects: Land value, unaffordability, educational attainment, mental health/depression, health, wellbeing, air quality, reduced NHS cost, productivity (sick days), invasive species, pollinators (increased agricultural production
Problem dimension: WATER QUALITY
- Direct causes: Cooling of facilities, Cement dust, Deforestation (from quarrying), Highway drainage, Boat-building (legacy use of copper), Sewage treatment, Misconnections (foul and surface water), CSOs, industrial heritage, agriculture, waste water, treatment technology, contaminated land, population growth, construction
- Indirect causes: Industrial heritage, quarrying, abstraction, chalk landscape, air quality (poor), Thames water quality, wind, landfill sites, (groundwater), missed connections, reduced river availability, perception of sewage treatment facilities, maintaining existing system, adoption of SuDS (uncertainty over), lack of awareness of environmental issues
- Drivers of change: Historic legacy, population increase (increase in vehicle use), EA Basin Management Plan, mind-set stuck, lack of awareness of environmental issues, urbanisation, water industry innovation, national legislation (change)
- Direct effects: Biodiversity (invertebrates), visual appearance (turbidity), algal blooms, bathing (health), recreational use of lakes/rivers, wildlife, population health (wellbeing), amenity (recreational activities), biodiversity
- Indirect effects: Attractiveness of place, house values, willingness to look after areas, monitoring, land value, cost, place making
Problem dimension: WATER USE
- Direct causes: Reduction in quarrying, water metering, smart meters, rainwater harvesting, grey water recycling, education/awareness, water wastage (unaccounted for and leakage), industrial processing, construction (temporary) and household, water recycling and reuse (commercial and residential)
- Indirect causes: Climate change, landscaping, gardens/vegetation, irrigation strategy, agro-industry, business types, plant types, education, attitudes towards efficient resource use, groundwater abstraction
- Drivers of change: Policies (water companies and local authority), urbanisation, short-term thinking, water industry innovation, urbanisation
- Direct effects: Biodiversity, water quality, ecosystem health, need for infrastructure, water bills, investment requirements, reduction in reinforcements (trigger points), reduction in peak points (e.g. 8am showers), reduction in total amount of water needed treatment, reduced bills
- Indirect effects: Greening of ‘garden city’, desirability of area, aesthetics, more water in the environment (e.g. volume in rivers), reduced costs, increase in disposable income, increase in environmental awareness, environmental gains (more water in the ground)
Problem dimension: FLOOD RISK
- Direct causes: Extreme rainfall, SuDS, infiltration rates, building design, pumping of water in Eastern Quarry, designing for exceedance, increase in impermeable areas, changes in rainfall patterns, mitigation measures, maintenance (lack of), split between surface and foul water (opportunity in Eastern Quarry), presence of flooded parks, innovative multi-purpose SuDS (not green SUDS)
- Indirect causes: Climate change, impervious surfaces, groundwater, conventional solutions persist (mind-set), tax legislation when it comes to urban creep (planning system), local authority costs, building in the floodplain, perception of flood risk of development, presence of detailed Surface Water Management Plans
- Drivers of change: Green infrastructure policy, Thames 2100 (EA), urbanisation, SPD plans, community engagement
- Direct effects: Localised flooding, land value, risk to the developer, insurance availability, perception/awareness of risk, capital repair costs/recovery time, insurance costs, human life costs, infrastructure and environmental damage, direct health consequences (respiratory disease)
- Indirect effects: Stress (mental health), unusable green spaces, community stress (fear of flooding), connectivity (lack of), access (lack of), availability of goods, mental health, reduction in cost in long-term, reputation risks (impact on place making)
Problem dimension: QUALITY OF PLACE
- Direct causes: Green infrastructure, open spaces, visual/access to water, proximity to water and green spaces, sense of community, perception of safety, traffic/noise, connections (transport), access to London, public water use (fountains, etc.), wildlife, access to green space, recreational use, integrated solutions, presence of a community (close to where you live), local/historic character reflected in design, good design (developer scale)
- Indirect causes: Fear of crime, education/awareness of the ‘value’ of water/green spaces, integrated planning, good design (community scale)
- Drivers of change: Innovative policies, population power/popular demand, existence of institutions that can facilitate sustainable solutions (e.g. Ebbsfleet Development Corporation), engaged community
- Direct effects: Mental health and wellbeing, property values, sense of identity, community stewardship, sense of ownership, air quality, temperature regulation, sustainable transport, amenity, biodiversity
- Indirect effects: Sense of community (pride), increase in land prices/value, gentrification, demographic change, community building, community engagement with the environment
Next step: mapping out the metrics
In the next workshop, the stakeholders took each problem dimension and selected a metric that defines it and the most relevant variables (Figures 2-5). The variables were chosen in terms of their impact on the metric (does it cause it to increase or decrease?). BIODIVERSITY was not mapped out as consensus could not be achieved between the stakeholders.
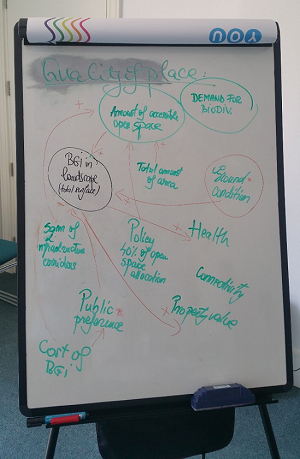
Figure 2. Problem dimension: Quality of Place. Metric: Total surface of BGI in the landscape
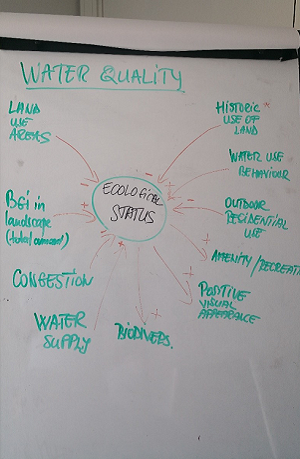
Figure 3. Problem dimension: Water Quality. Metric: Ecological status
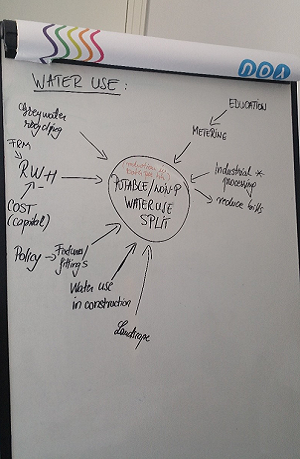
Figure 4. Problem dimension: Water Use. Metric: Potable/non-potable water use split
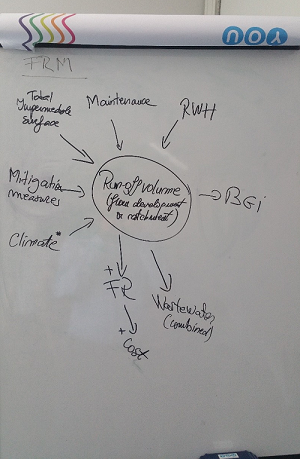
Figure 5. Problem dimension: Flood Risk management. Metric: runoff volume
This blog was a collaborative effort by members of the Urban Flood Resilience team. For more information on the Ebbsfleet LAA contact Tudor Vilcan.
No comments yet, fill out a comment to be the first
Leave a Reply