October 3, 2013, by Helen Whitehead
Images of sustainability
Some of the images used in the iBooks and eBooks on sustainability – on which the materials for the MOOC Sustainability, Society and You are based – are fascinating.
The University of Nottingham’s model for understanding sustainability – the 5C model.

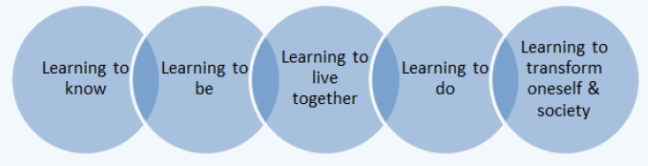
The holistic definition of education for sustainable development that the UN works to can be described in this diagram:
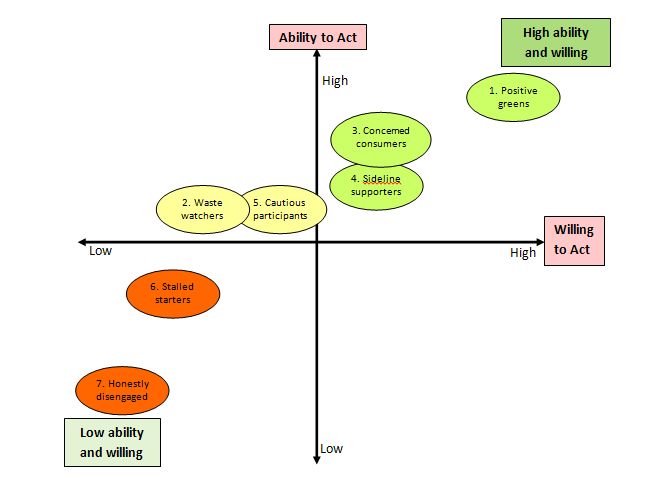
In a study in 2008, Defra found the UK population could be divided into seven broad segments. Each segment was defined upon a person’s ability and willingness to act on sustainability goals together. The seven segments were:
1. Positive greens
2. Waste watchers
3. Concerned consumers
4. Sideline supporters
5. Cautious participants
6. Stalled starters
7. Honestly disengaged
The seven segments of the UK population based upon a person’s ability and willingness to act on the 12 sustainability goals together, as defined by Defra (2008), are shown diagrammatically:
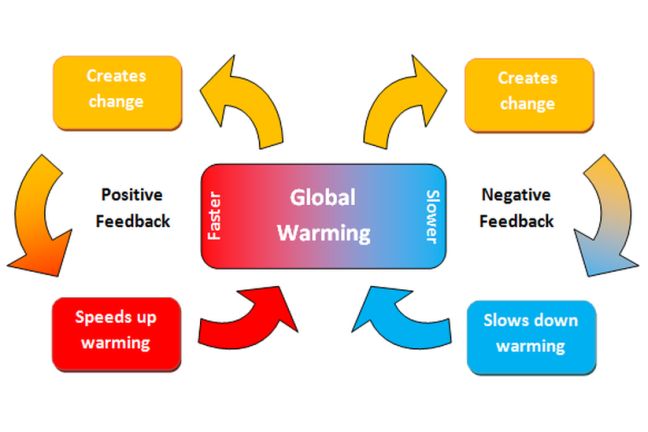
There are many feedback mechanisms that occur in the climate system and which can speed up or slow down global warming. For example, there is ice albedo feedback, and water vapour feedback. The Amazonia dieback feedback mechanism is a positive feedback mechanism, because it speeds up warming of the atmosphere, there are also negative feedbacks, which can slow down warming. The Figure below shows how positive and negative feedback mechanisms affect global warming.
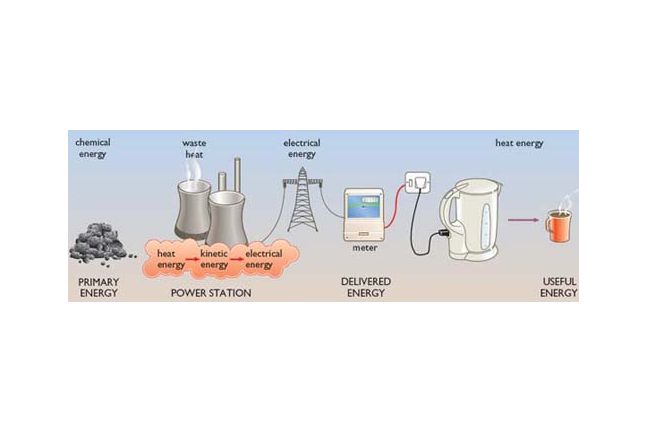
The efficiency with which humanity currently uses its energy sources is generally very low. At present, only about one-third of the energy content of the fuel the world uses emerges as ‘useful’ energy, at the end of the long supply chains we have established to connect our coal and uranium mines, our oil and gas wells, with our energy-related needs for warmth, light, motion, communication, etc. (see Figure below). The remaining two-thirds usually disappears into the environment in the form of ‘waste’ heat. One of the reasons for our continuing inefficiency in energy use is that energy has been steadily reducing in price, in real terms, over the past 100 years.
Figure. An example of one of the energy ‘chains’ linking primary energy with delivered energy and useful energy, via various energy transformations.
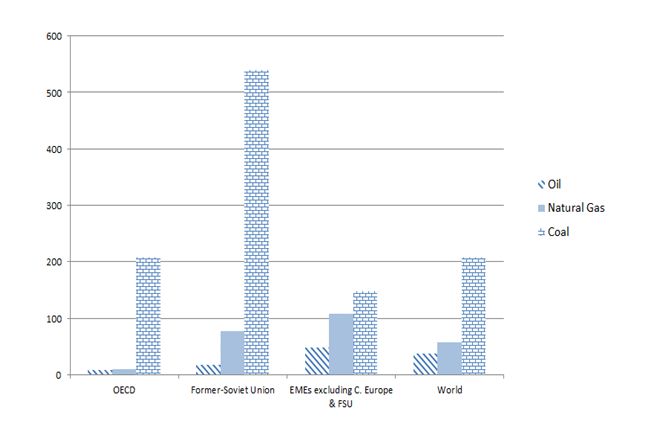
Reserves/production (R/P) ratios (in years) for oil, natural gas and coal, in 2000, for various regions of the world and the world as a whole
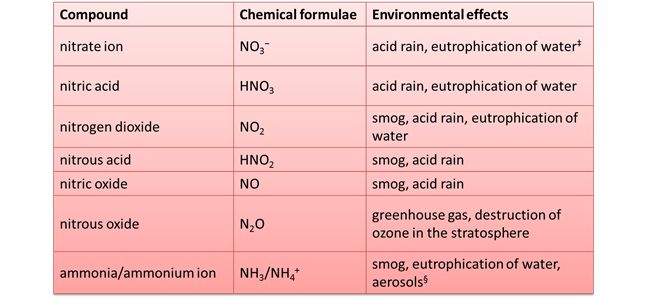
The apparent ‘need’ for chemical fertilisers to feed the large proportion of the world’s human population is now the major source of nitrates in the environment. This is having considerable environmental impact. Nitrous oxide is a significant greenhouse gas but there are also other environmental effects, as outlined in the following table:
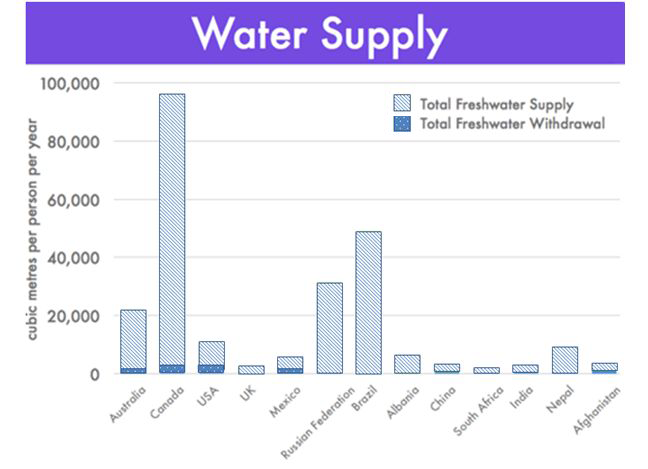
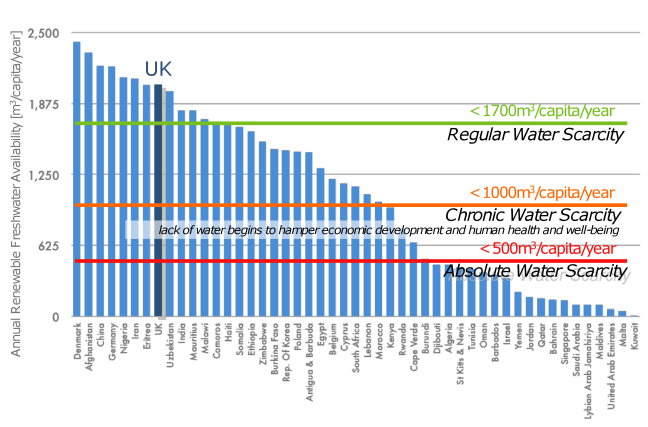
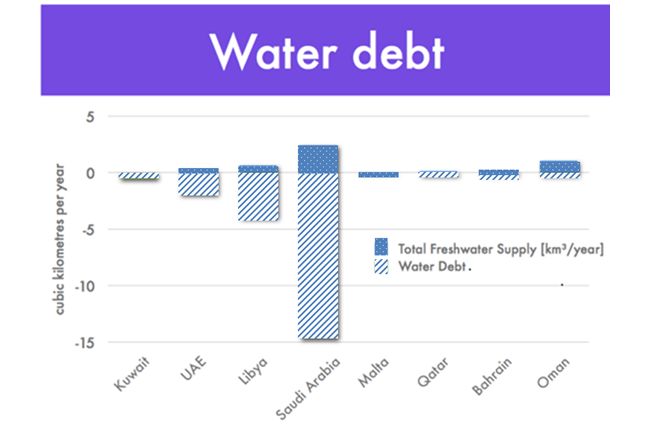
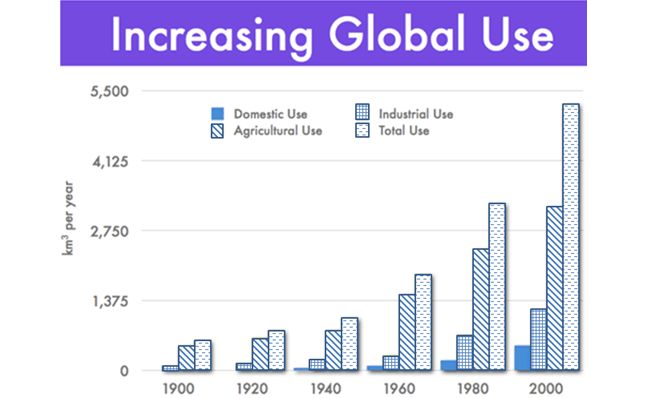
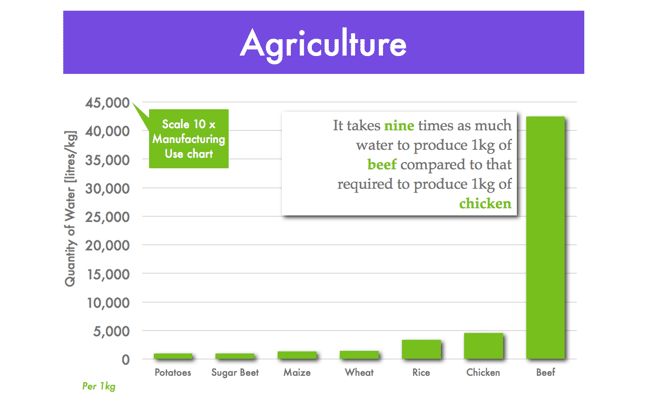
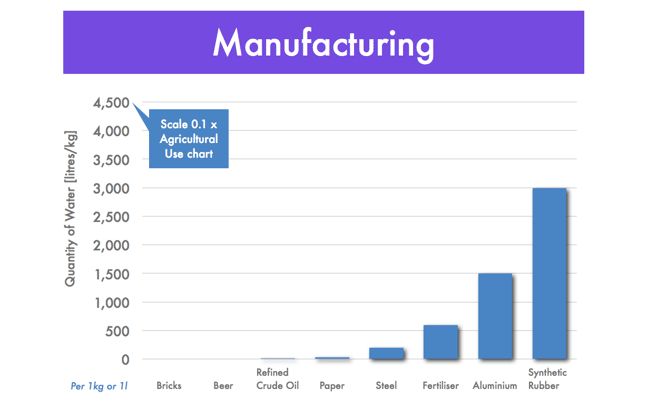
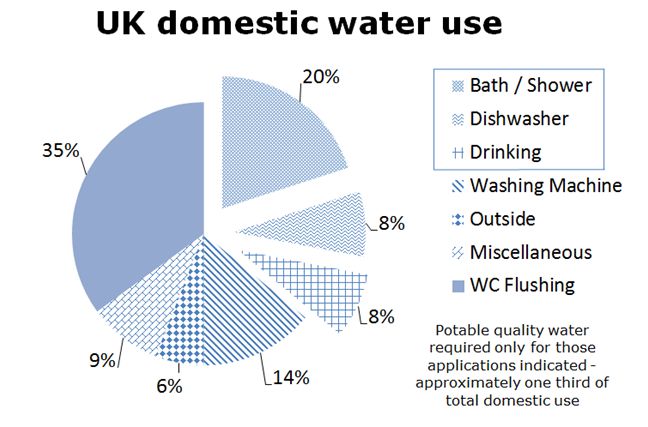
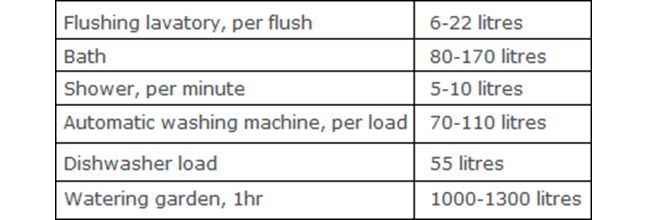
Some figures about water
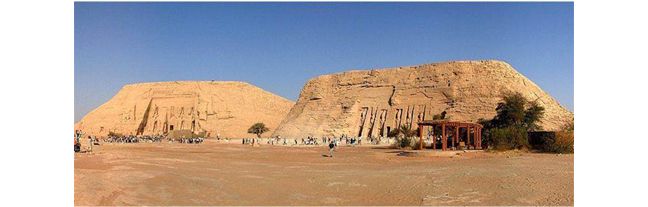
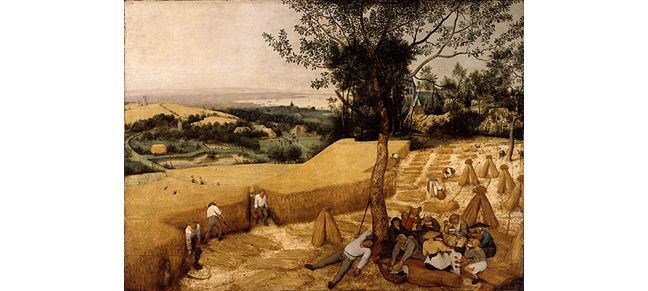
Some examples of heritage:


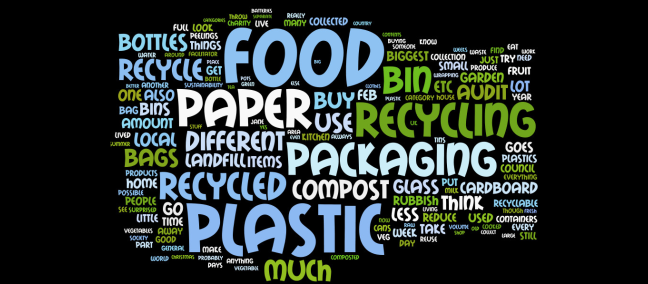
Waste audit wordle
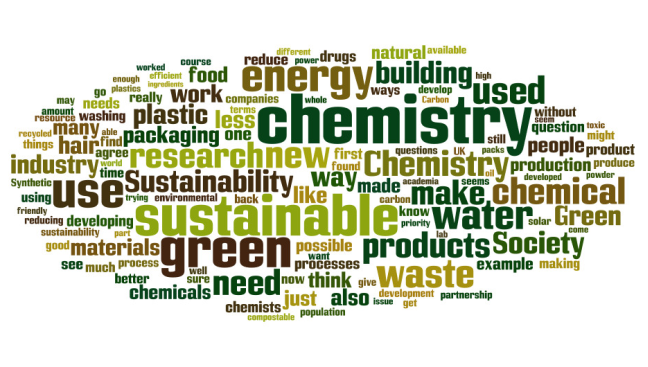
Green Chemistry discussion Wordle
No comments yet, fill out a comment to be the first


Leave a Reply