
April 16, 2015, by Teaching at Nottingham
Evaluate Report February 2015
Evaluate was introduced in September 2014 to electronically collect Student Evaluation of Teaching (SET) and Student Evaluation of Module (SEM) feedback. This replaced previous paper based SET and SEM questionnaires.
On 16/1/2015, Information Services extracted all the UK surveys in Evaluate and sent this as a spreadsheet to Professional Development. The following results are from these data.
Numbers of Surveys
Since September 2014, 3712 surveys have been created for the UK in Evaluate. These 3712 surveys are for 1708 different (distinct) modules. Of the 3712 surveys created, 3048 have had student responses. About half of the surveys which have had 0 respondents are for surveys which are open after 16/1/2015. These values are shown in Table 1.
| SET | SEM | TOTAL | |
|---|---|---|---|
| Number of Surveys created | 2230 | 1481 | 3712 |
| Number of different modules evaluated | 1449 | 1441 | 1708 |
| Number of Surveys with 1 or more responses | 1840 | 1208 | 3048 |
In 2013/14, 2963 SET surveys were completed. In comparison, in Semester 1 in 2014/15, 1840 SET surveys have been completed. This suggests that more teaching will be evaluated in Evaluate than for SET previously.
Survey Type
There are 2 ways to create surveys in Evaluate, these are:
- Saturn surveys – these surveys get the majority of their information from Saturn, including the number of students registered on the module. Only those students registered on the module can complete this type of survey. 87% of surveys in Evaluate are Saturn surveys.
- Non-Saturn surveys – the details for these surveys have to be entered by the SETSEM coordinator, including the number of students who are to complete the survey. A PIN code is created each time and any student who has the PIN code can complete the survey. 13% of the surveys were created as non-Saturn surveys.
Non-Saturn surveys can be used to create surveys for modules that do exist in Saturn as well as those that aren’t necessarily recorded in Saturn. Examples of where these types of surveys may be used could be:
- For SET surveys where a teacher teaches only a small group of the registered students on the module
- For SEM surveys where the module is taught as separate groups
- For modules that are not listed in Saturn
In these examples, several SET or SEM ‘Non-Saturn Modules’ may be created, one for each teacher on the module.
Response Rate
Evaluate compares the number of student responses to each survey with the number of students registered on the module and provides a response rate. In order to analyse the response rate for 2014/15, the 664 surveys with no responses were removed. There were also 14 ‘Non-Saturn’ surveys that had a response rate over 100%; these were also removed from the analyses. Also, any surveys that had an End Date after 15/1/2015 were removed as students were still responding to these. The response rate of the 2972 remaining surveys was investigated. Response rate by school is shown in Figure 1; schools are sorted by SEM response rate, with those schools with a lower SEM response rate on the left of the graph.
Figure 1. Mean SEM and SET response rate and response rate by school
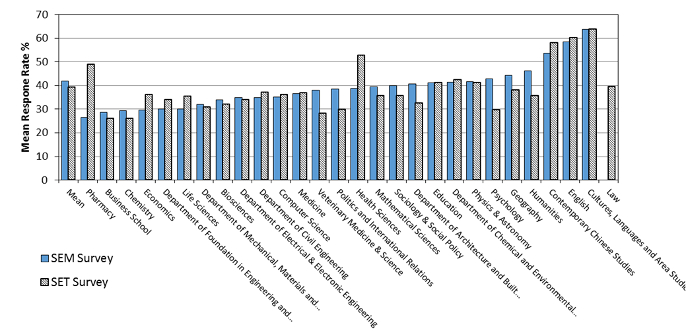
The SEM response rate ranged from 27% to 64% with a mean of 42%1 and the SET response rate ranged from 26% to 64% with a mean of 39%. Most schools had less than 10% difference between the SET and SEM response rate, apart from for Pharmacy and Health Sciences which have a 22% and 14% respectively higher SET response rate and the Schools of Psychology, Humanities and Veterinary Medicine and Science which have over 10% higher response rate for SEM surveys. For individual staff, the response rates vary from less than 1% to 400%.
Comparison with previous SET response rate
Prior to 2014/15, paper SET questionnaires were completed by students, responses were input by a data entry company and results posted to the lecturers. To enable comparison with Evaluate, all the paper SET responses were collated and the following details were provided:
- Year of Survey
- Module Code
- School
- Number of SET questionnaires completed
- Number of students registered on the module in Saturn
From 2004 to 2014 there were over 26,000 SET surveys completed by 820,000 students. Surveys before 2009/10 and those surveys that had a 0 number of students registered on the module were removed from the analyses. The response rate was calculated and any surveys with a response rate of over 100% were removed. Nearly 13,000 surveys remained.
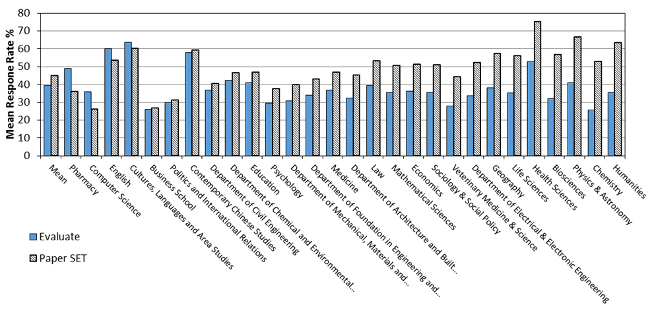
The mean SET response rate for each school for Evaluate in 2014/15 and SET from 2009/10 to 2013/14 are shown in Figure 2. Schools are sorted by the difference between the Paper and Evaluate response rate, with schools on the left of the figure having a higher response rate for Evaluate and schools on the right having a higher response rate for paper SET.
Overall, Evaluate had a mean SET response rate of 39.3% whereas SET previously had a response rate of 44.8%, so 5.5% of responses have been lost. This ranged from a gain of 13% of responses for Pharmacy in Evaluate to a loss of 28% of responses for Humanities. 4 schools have a higher response rate in Evaluate, 9 schools (Business School to Department of Foundation Engineering) have less than 10% fewer responses in Evaluate and 15 schools have had their response rate drop by more than 10%.
Figure 2. Mean Set response rate for Evaluate and Paper
The table below shows the range in response rate for schools for Evaluate and previous SET. Both methods of data collection have similar minimum and maximum response rates.
| Minimum | Maximum | |
|---|---|---|
| Evaluate | 0.0% to 11.0% | 71.0% to 100% |
| Paper SET | 0.4% to 11.8% | 86.7% to 100% |
The response rates for Evaluate and for previous paper SET were compared by module size. Modules were grouped by module size of more than 200, 100 to 199, 50 to 99, 30 to 49, 15 to 29 and 1 to 14 and the response rate for each group calculated, results are shown in Table 3. This shows that previously (Paper SET) an average of 45% of responses was achieved, ranging from 70% when there were less than 15 students on the module to an 18% response rate when there were over 200 students on the module. For Evaluate there is on average a 39% response rate for SET, ranging from 59% when there are less than 15 students on the module to 21% when there are 200 or more students.
| Numbar registered students | Evaluate | Paper SET |
|---|---|---|
| >200 | 21 | 18.3 |
| 100-199 | 23.3 | 30.7 |
| 50-99 | 32.1 | 42.7 |
| 30-49 | 40.9 | 54.7 |
| 15-29 | 49.8 | 62.4 |
| 1-14 | 58.7 | 70.2 |
| Mean | 39.3 | 44.8 |
Both methods of data collection show a large decrease in response rate as module size increases and Evaluate generally has a lower response rate than for previous paper questionnaires, apart from for modules with over 200 registered students. Overall, Evaluate has 5% fewer responses than SET previously.
SEM was previously completed within schools and the data were not held centrally, so it is not possible to do similar comparisons for SEM.
Length of Survey
It is recommended that surveys in Evaluate are open for the duration of the lecture, so that students know they have to complete the survey during this time. Schools/lecturers can however choose how long they wish to keep open each survey. A comparison between the number of hours a survey was open and the response rate was carried out to see if the length of time a survey was open had any effect on response rate. There were no correlations (r=-0.005, p=0.791), so the number of hours a survey is open has no positive, or negative, effect on the response rate.
Schools vary greatly in how long they keep their surveys open, as shown in Figure 3. For individual surveys this ranged from surveys being open for 30 minutes to 163 days. Computer Science on average keeps their surveys open for 2 hours 10 minutes with a range of 2 to 3 hours and an overall response rate of 36%. In contrast, Education keeps their surveys open for 24 days with a range of 2 hours to 42 days, their overall response rate is 41%.
Figure 3. Average number of days surveys are open
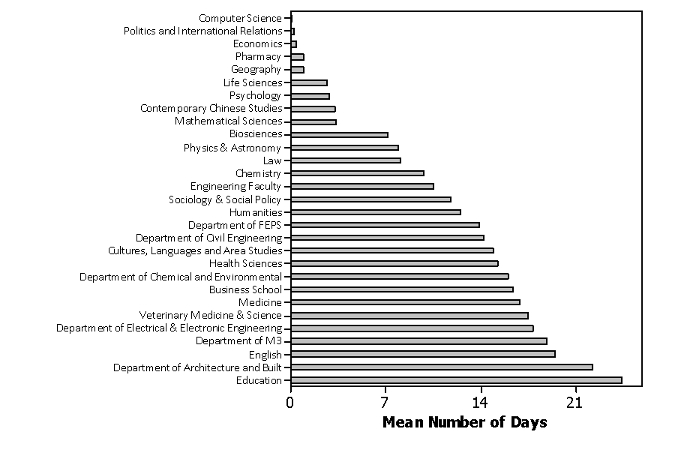
Only 5 schools keep surveys open for less than a day – Computer Science to Geography, 4 schools keep their surveys open about 3 days – Life Sciences to Maths. All other schools keep their surveys open for 1 week or longer.
Conclusion
There have been a number of issues with the introduction of Evaluate, some of which have affected staff’s perceptions of the system. However, this report shows that large numbers of surveys have been created by SETSEM coordinators and completed by students and it is likely that more SET surveys will be completed in 2014/15 than previously (it is not known how many SEM surveys were previously completed). The mean response rate by students is currently about 40%, but this varies widely for individual schools from about 26 to 64% and for individual surveys the response rate ranges from 0 to 400%. When the response rate in Evaluate is compared with the response rate in previous academic years, on average there is a 5.5% reduction in responses in Evaluate, with a few schools having more responses in Evaluate and the majority having fewer responses. As students and schools get more used to the system, this response rate should improve.
The amount of time a survey was open for had no effect on response rate. There was a very large variation in the amount of time individual surveys were open for and a large variation in the mean time that schools opened their surveys. Due to the way some modules are run, some surveys may need to be open for a long time, but the majority should only need to be open for a relatively short time as this has no effect on the response rate.
For further details about Evaluate, please visit the Professional Development website at: http://www.nottingham.ac.uk/professionaldevelopment/learningandteaching/evaluate/index.aspx. The Evaluate Policy, User Guides for Lecturers, Students and Administrators and details about how to maximise response rates can all be found on the Guidelines page.
1 By 16/1/2015 the School of Law had not completed any SEM surveys, these were done during February 2015
No comments yet, fill out a comment to be the first


Leave a Reply