« return to post


20220420_125324
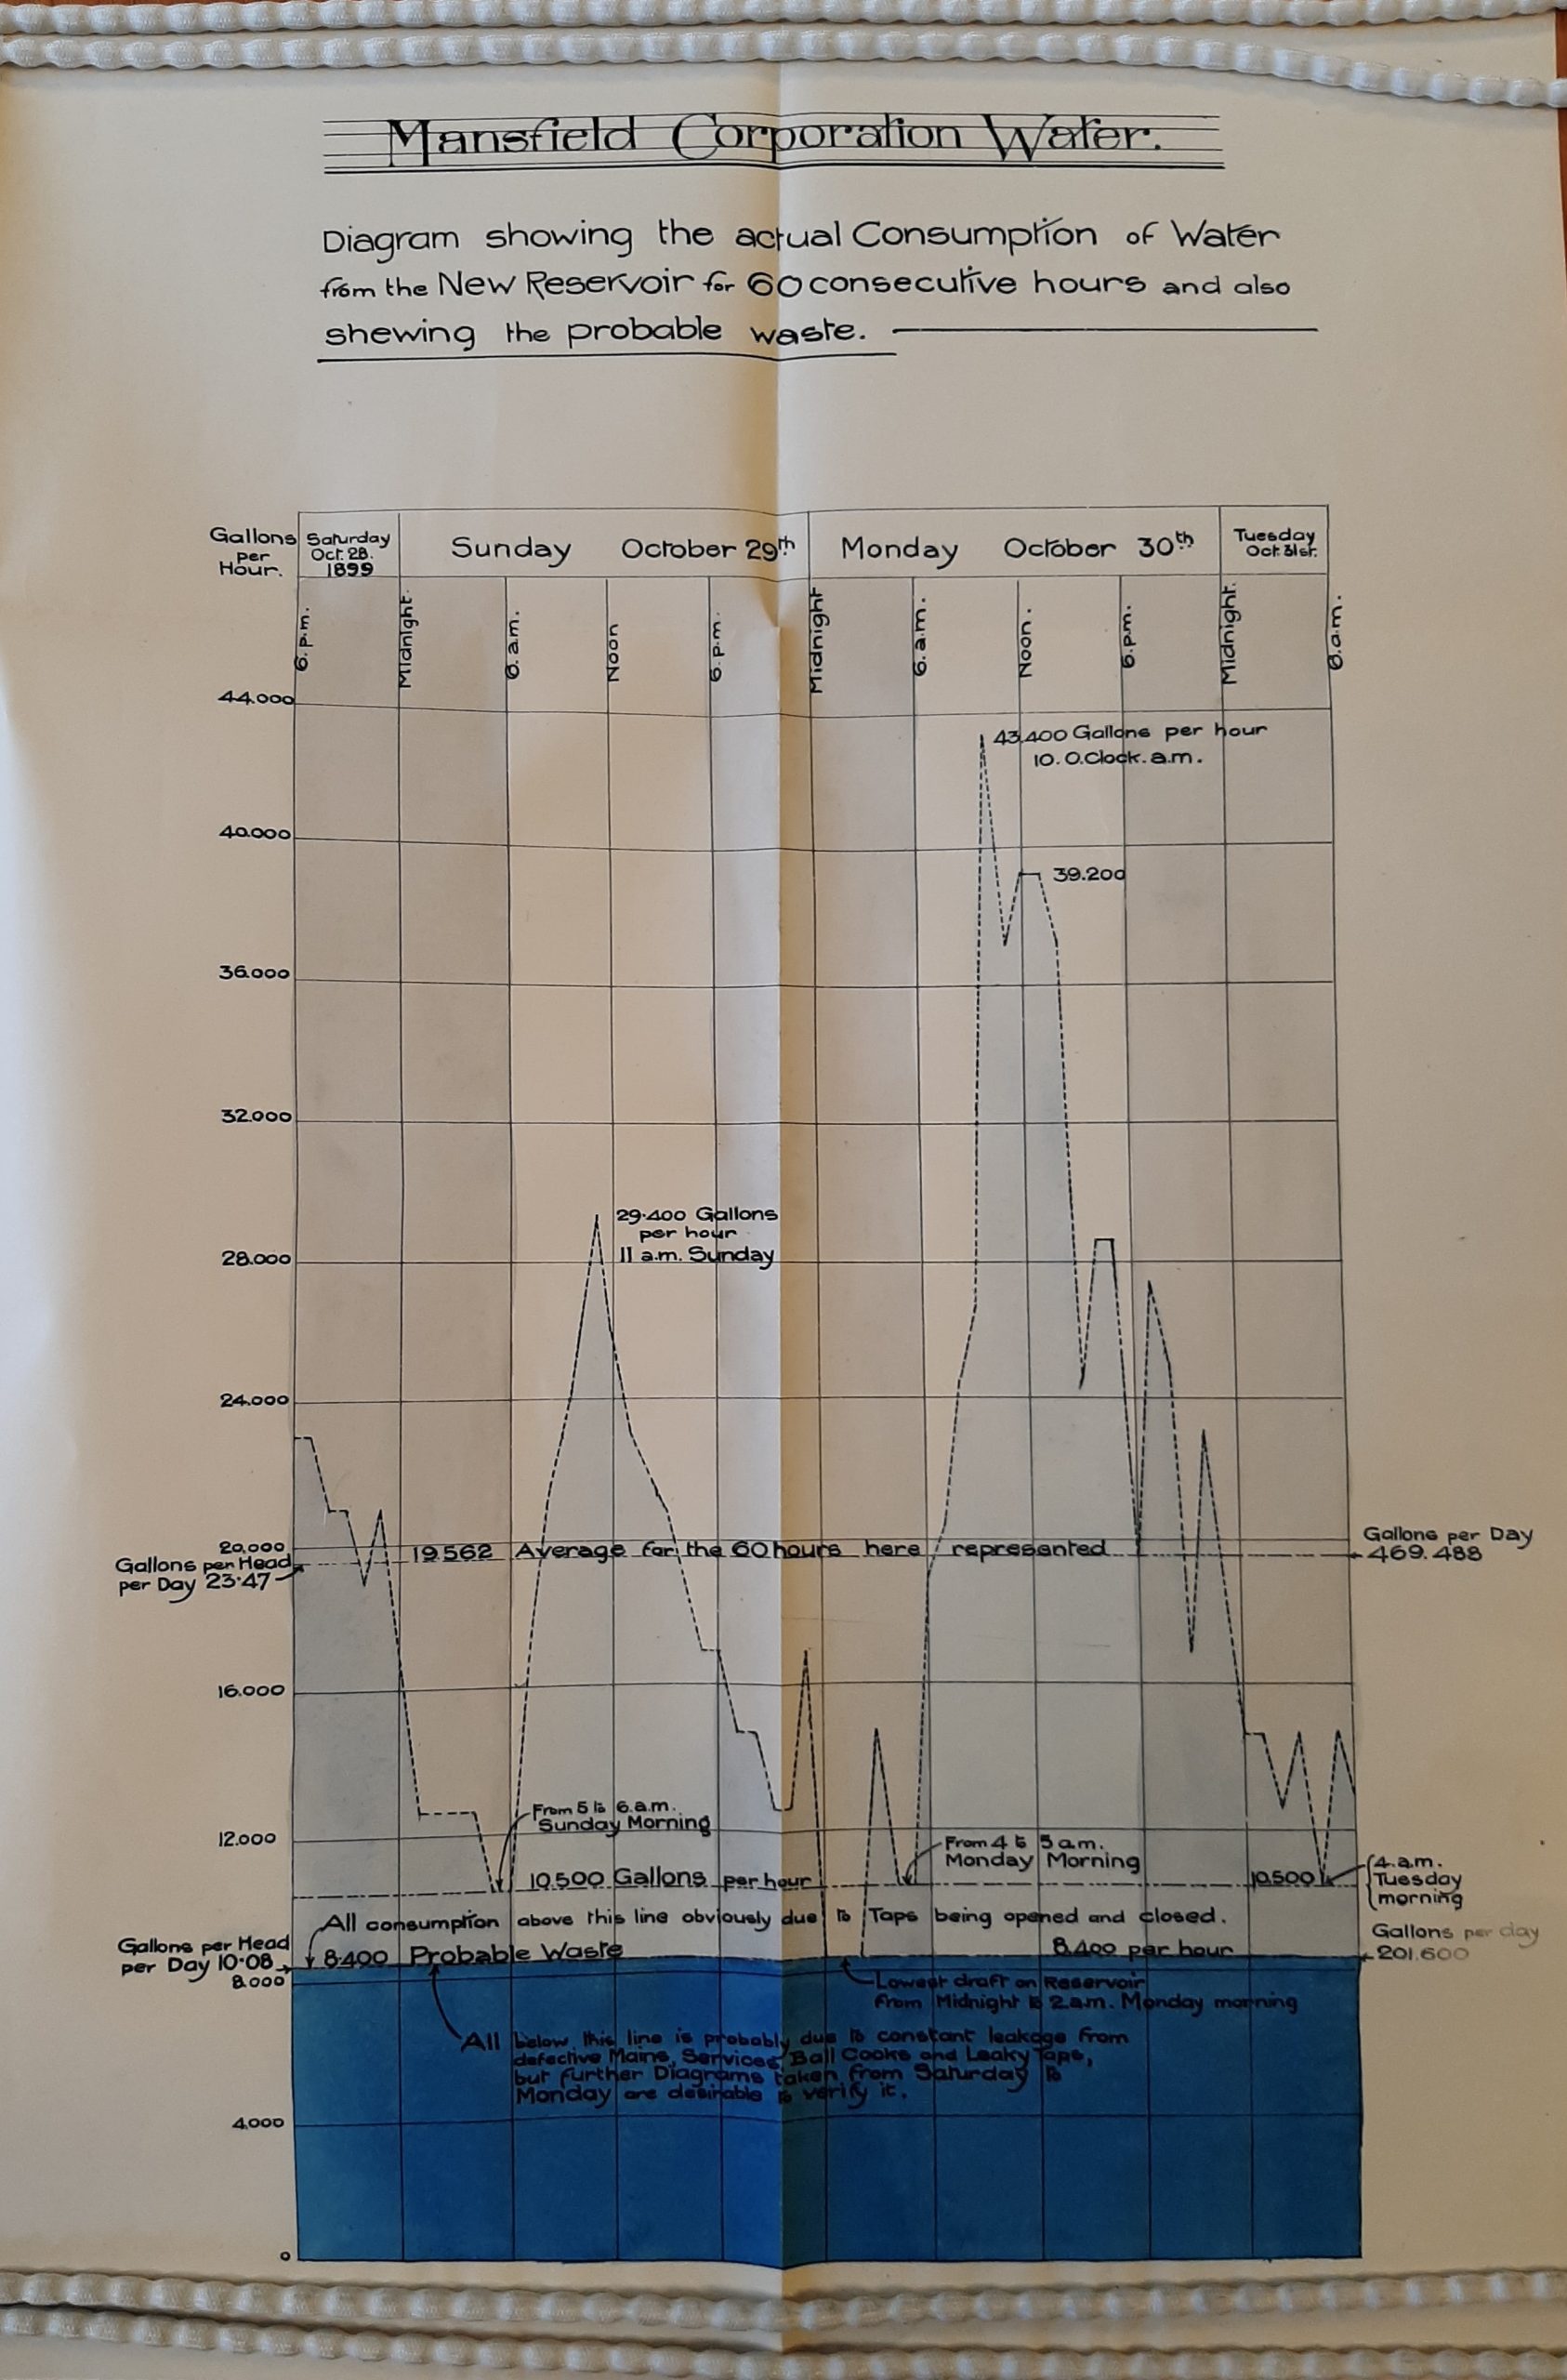
The chart proving the leak. The light blue shows demand, and everything in dark blue is water escaping from the system.


