June 12, 2023, by sbzgm6
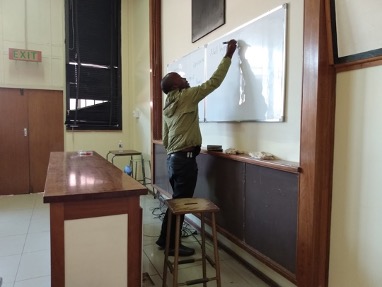
Prof. Murray Lark delivered statistics research methods module for University of Zimbabwe students
I recently read a remarkable book called Victorians and Numbers (Goldman, 2022). This tells the story of how a diverse set of academics, campaigners and politicians in Victorian Britain were enthused by the idea of collecting, analysing and visualising data to identify social problems and injustices and to support policies to address them. Parallel movements in the rest of Europe, led by important figures such as Quetelet from France, were developing similar ideas, and this culminated in a meeting of the International Statistical Congress in London in 1860. This international statistical movement failed for a number of reasons. Their plans to agree standardised formats and units for key variables to be used internationally came to grief on the shoals of stubborn national pride. Furthermore, they had not really given sufficient thought to the question of how inference from numbers would really answer scientific questions in a meaningful and robust way. That was to require further conceptual development. However, this first wave of the statistical movement left important legacies, not least the enthusiasm of one of its key figures, Charles Babbage, for the idea of automated computation. Another legacy was the word statistics itself, originating in the idea that data are information primarily of importance for the efficient operation of the state.
Statistical methods and computation have been fundamental to the MAPS project and the GeoNutrition project which preceeded it. The scientists involved in these projects are committed to the idea that quantitative information from experiments and surveys is key to the implementation of effective interventions to address micronutrient deficiencies. Statistical design and modelling have allowed robust spatial maps to be made from data on micronutrient concentrations in soil, crops and human biomarkers, with quantification of uncertainty.

Figure 1 Grain Zn concentration in maize grain across Malawi. (a) Empirical Best Linear Unbiased Predictions and (b) the prediction error variance. This figure is reproduced from Botoman, Chagumaira et al (2022) under the terms of a Creative Commons Attribution 4.0 International Licence http://creativecommons.org/licenses/by/4.0/
Statistical analysis allows meaningful results to be obtained from experiments in which the replicates are distributed between farms across complex landscapes, with repeated measurements in successive seasons. Statistical training has therefore been part of both projects from the beginning, drawing on experience and material developed in the CEPHaS project on conservation agriculture practice. Training delivered by MAPS project staff to project researchers has also benefited researchers from partner organisations in Africa and Asia.
In February and March 2023, I took this training programme a stage further when I delivered a four-week training programme to post-graduate students at the University of Zimbabwe (UZ). UZ has embraced modular teaching across its courses, and post-graduates in the Faculty of Agriculture take a module on Advanced Research Methods. This year this included a set of 15 lectures and practicals on statistical methods.
The training put strong emphasis on design, both for experiments and surveys. This was deliberate. Many things can go wrong in science, but the best way to ensure efficient use of resources and robust outcomes is by a sound design which maps onto an analysis which will directly address the question of interest. As well as the basics of design, we addressed some advanced methods required in research, such as incomplete block designs, and the design of sample surveys.
In addition, the course was based on the R platform, which also underpins the MAPS project (R Core Team, 2023). R is an open-source platform. It facilitates collaboration, and reproducible research in which researchers can share their code, allowing readers to explore published work in depth and to take up methods for their own research. Furthermore, R is widely used by statisticians, so new methods are generally accessible to R users long before they are taken up by other statistical software. Most participants in the training had not used R before, but by the end all were able to use it to read, explore and plot data and to undertake a range of analyses.

Class quiz on basic statistical concepts: from degrees of freedom to randomisation.
Feedback on the training was positive, and participants performed well in assessments. Of course, the proof of the training comes down the line when the principles of design and analysis are applied in research on the ground.
No comments yet, fill out a comment to be the first


Leave a Reply