February 10, 2012, by Camilla Jensen
Malaysia and the frontiers of growth
 This is the second in our series of special blogs about the development and challenges facing the Malaysian economy by Associate Professor Camilla Jensen. Camilla is Director of Studies of the Nottingham School of Economics at the University of Nottingham Malaysia Campus. Her research covers foreign direct investment, economic growth, regional development and institutional change.
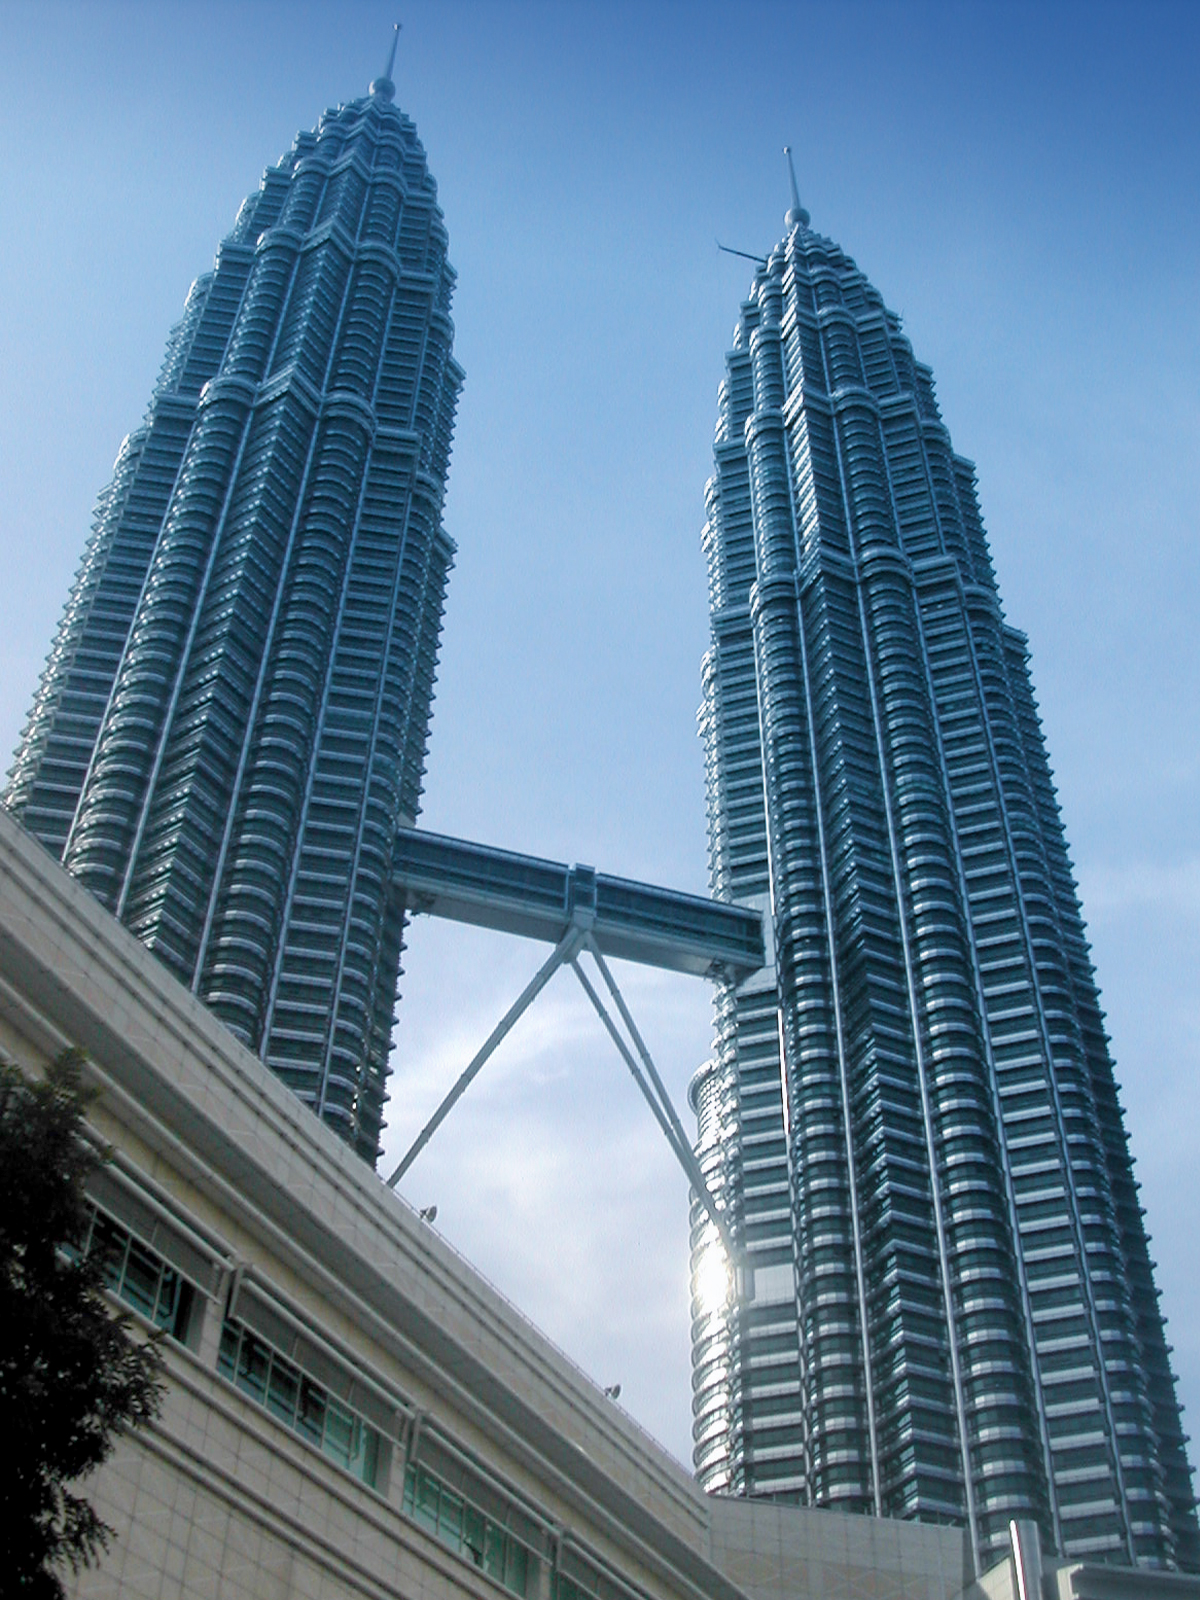
The third and fourth lectures I attended were on the same day given by two Korean professors. One was in Petaling Jaya (a suburb to Kuala Lumpur) and the other at the Kuala Lumpur Convention Centre (just below Petronas Towers that you can see on the photo). Anyone who has experienced the traffic around Kuala Lumpur would have been hesitant about aiming to go for both of these lectures. But it was a very difficult choice.
The first lecture given at the Malaysia Productivity Corporation was by Dr. Hak K. Pyo who is Director of the Centre for National Competitiveness and Professor at Seoul National University. The second lecture organised by Khazanah Nasional was given by another high profile Korean Professor and Development Economist, Professor at Cambridge University – Dr. Ha-Joon Chang (author of the book ‘23 things they don’t tell you about capitalism’). It was too difficult a choice so I opted for attending both.
The traffic in Asia makes me think about the resemblance between the traffic, the problems of the traffic and the economy. The cars and the roads are what we call physical capital (K) in economic growth theory. The drivers are the laborers (L) or workers. They may be endowed with skills (h) accumulated through education and experience. The output (Y or GDP) is transport services produced which has both a quantity and quality dimension to it. For example driving from the airport in a limousine will give a higher GDP than if the same service in kilometres is rendered by a scooter or bus service. Technology (A) underlies it all and is very difficult to reduce down to any particular measurable thing that we can then aggregate up the way that we can aggregate up L (total hours worked) or K (in monetary units invested).
Technology is therefore included in a ‘residual’ that we call total factor productivity (TFP). Technology includes basic innovations of the combustion engine, different types of cars, fittings such as airbags and GPS. Major transport innovations such as air, rail and sea transport are considered to be ‘meta’ technologies. Even the Internet may affect the transportation system, in fact it can altogether reduce our need for transport as we can work from home using email and attending online conferences (no wonder GDP growth is slowing down…!?). Besides technology, the written and unwritten rules, norms and behaviour surrounding the transport system are also important. This we call in economics the institutions (I). The institutions may be both formal and informal. With formal we think of rules that are written down which would be the traffic regulations, traffic signs and their enforcement by the law officers. With informal we think about traditions, customs and norms in our culture that affect our behaviour but they are not written down anywhere. I think most people will agree that in the traffic these institutions also greatly affect the outcomes for the quantity and quality of the transport being produced. The economy also has a spatial dimension (e.g. layout or geography), however, we do not have any separate aggregate concept hereof so differences in the spatial dimensions of countries are also counted along with technology and institutions into the overall TFP or total factor productivity. Solow showed in his famous 1957 article that most of the growth in the US economy came from this source.
Generally we think about economic growth as affected by all these factors and without being specific about the exact mathematical relationship between inputs and outputs we could write it as: Y = F(A, I, K, L, h)
This brings me back to the lecture given by Professor Pyo from Seoul National University. His lecture focused on one of the most fundamental problems in economic growth research. How to correctly estimate the overall contributions to growth from the underlying factors (e.g. in the neoclassical model that would be capital, labour, education and total factor productivity). Professor Pyo’s extensive research on this shows the great problems in countries that do not conduct regular census surveys to help estimate the size of the capital stock. Without exact measures of the historical capital stock, economists often have to resort to something called the ‘perpetual inventory method’ (Nehru and Dareshwar, 1993 explains it well).
It is a method whereby over a long time series adding up the new investments and from them deducting depreciations (deteriorations in the capital stock due to usage, wear and tear) the capital stock may be guestimated. However, according to Professor Pyo for an exact measure it requires a time series of up to 100 years. This is impossible in the case of for example Malaysia, since the nation state of Malaysia dates back only to 1957 (or as we know it today to 1963 when East Malaysia was included) and the macroeconomic recording of data for young nations is also relatively difficult as a proper system of national statistics must be put in place and this in itself takes at least a decade for a new nation.
I tried to estimate such figures based on the World Bank data (that starts for most series as late as 1970), but instead using the reported size of annual depreciations D and using the simple rule of thumb that the rate of depreciations d is approximately 5%. On the back of an envelope we can easily see that K≈D/d. I show the results for both Singapore and Malaysia in Figure 1.
Figure 1
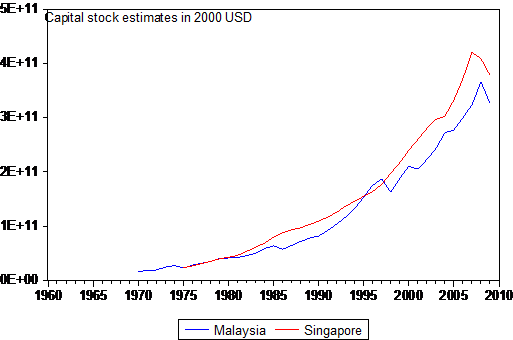
Figure 2
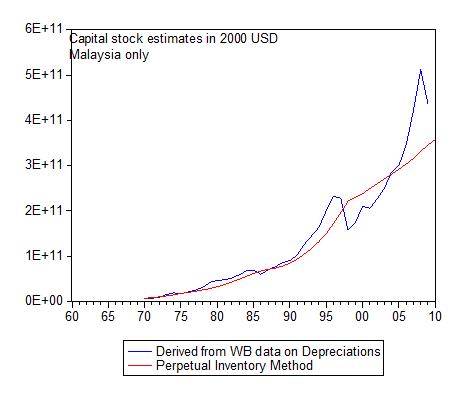
I also calculated the same data instead using the perpetual inventory method for Malaysia (again assuming a depreciation rate of 5% and setting the capital stock in year zero at the size arrived at using my above estimates). The results came out very similar as shown in Figure 2, and it is clear that there is something circular in the case
of the Malaysian dataset – most likely because D historically has been approximated using similar methods as my own which closes the circle (when D is not available from national censuses the World Bank finds the estimates as described here).
Thereby we can see that Prof. Pyo is right and that the data is extremely fragile to measurement error and there is almost complete ignorance about the size of the initial capital stock (here in 1970) or the true size of the capital stock at the moment. As time passes this problem becomes smaller and smaller but only disappears by 2070 according to Professor Pyo. This is not an unusual problem and is the case for many economies’ datasets on capital stock.
Table 1
| 2010 | ||
| Malaysia | Singapore | |
| GDP per capita (2005 PPP iUSD) | 13,200 | 52,000 |
| Land (km2) | 329,750 | 778 |
| Capital (2000 USD) | 330 bio | 380 bio |
| Population | 28 mio | 5 mio |
Source: World Development Indicators, The World Bank, Washington D.C.
According to my calculations Malaysia and Singapore have about the same capital stock – in the case of Singapore sunk into an area of only 778 km2 whereas in Malaysia an almost similar sized capital stock is spread out over an area of 329,750 km2. Malaysia has 11,800 USD of capital per capita and Singapore has 76,000 USD of capital per capita. This seems very drastic. But maybe very similar results would be obtained comparing e.g. a capital city such as NYC or Warsaw with its state (New York) or country (Poland). From a population viewpoint the average Singaporean has much more capital and much less land to work with per capita compared to Malaysia. This alone should account according to the Solow model (where differences in capital endowment is the main explanatory factor of the differences in income levels) for a difference in GDP per capita of 6.40.4≈ 2.00
The actual difference in income per capita is 4. This should make us conclude that accumulating capital (e.g. by increasing savings) alone would bring Malaysia up to the level of an average high income country?
The problem is that it may not be so easy and the main question here might well be why it is so much less attractive to invest in Malaysia (as Prof. Wing Thye Woo asked on his lecture) in the first place?
The problems with the inexactness of the data is the reason why Professor Pyo has taken the initiative to encourage Malaysia to get involved in the endeavour of collecting more exact productivity data under the European initiative called KLEMS which involves a consortium between the EU, NAFTA (USA, Canada and Mexico) and some highly developed Asian economies such as Korea and Japan.
This endeavour is important from an Asian perspective since the Asian Growth Miracle in economics has been surrounded by a great controversy about the true size of productivity growth that took place in Asia in the 1970s, 1980s and 1990s. Professor Paul Krugman argued in his 1994 FT article that growth in Asia (as e.g. in the Soviet Union) was not sustainable because it relied on an extensive growth model (e.g. using more and more capital and labour rather than increasing productivity). Somehow today and despite the 1997 crisis this seems to be an unresolved story because growth has picked up almost everywhere across Asia and China has made a very successful transition to an intensive growth model.
The second lecture given by Professor Ha-Joon Chang was of a much broader nature. However, the lecture was centred on two recurring debates in economics that dates back at least to the time of Adam Smith and even to before the birth of classical economics. The first question was about the sectoral (e.g. agriculture, manufacturing, services) composition of the economy and economic growth. The second question was about the necessity for the state to intervene in the economy. The fact that these questions have remained unresolved for at least 5 centuries shows that economics is not a dismal but a very challenging science!
I will follow up on these questions posed by Professor Ha-Joon Chang in my next entry. Meanwhile I am looking forward to the next upcoming lecture about economic growth in Malaysia which is given by Professor Hal Hill from Australian National University at the upcoming GEP conference on ‘Trade, Investment and Production Networks in Asia’.
To be continued…
No comments yet, fill out a comment to be the first


Leave a Reply