July 30, 2024, by pczmj
BLA: An R Package for Boundary Line Analysis
This blog is by Chawezi Miti, a Rothamsted PhD student at the University of Nottingham School of Biosciences, funded through the Food Systems Institute.
As part of a joint PhD under the University of Nottingham and Rothamsted Research programme in International Agricultural Development, Chawezi Miti and his supervisors Professor Murray Lark (Nottingham), Dr Alice Milne (Rothamsted) and Professor Ken Giller (Wageningen University) have developed a user-friendly library of functions for the open-source R platform. This library, called BLA, will facilitate reproducible application of boundary line analysis, including data exploration, model fitting and post-hoc analysis. You can access and download the package through this linked page.
According to the UN Food and Agriculture Organization, a 60% increase in food production will be needed to meet the needs of the world population projected for 2050. This could be met in various ways, but it is widely agreed that making sure that land currently in production meets its yield potential is more achievable and sustainable than taking more land into production. This is sometimes called closing the yield gap, i.e. overcoming yield limitations. Furthermore, it is also agreed that yield gaps are poverty traps for rural communities (Tittonell and Giller, 2013)[1]; the failure to achieve potential yield represents a loss of income to smallholder producers.
To close the yield gap in some particular setting we must understand what the limiting factors are. If we were to obtain data on crop yield across a region, and an associated variable which represents some potential limiting factor, (such as soil available water capacity) then one way to interpret the data is to model the upper boundary on yield for different water contents. The figure below shows a plot for a hypothetical example, the red line is the modelled boundary and for some site, A, the difference between the boundary value and the observed yield, represents the yield gap.

Boundary line methods have been used mainly in agronomy but have also been applied to biophysical modelling problems in plant physiology, microbiology, ecology, plant/atmosphere interactions and forestry. In any of these fields the BLA library offers an array of methods to help the researcher derive meaningful insights from data. The boundary line approach is suitable for analysing biological response datasets from surveys i.e. cases in which multiple potential limiting factors to biological response occur but are not controlled, as is done in experimental conditions. In this case, one can determine the largest expected biological response (also called the boundary value e.g. crop yield) for a given value of a factor interest (e.g. soil N). Additionally, the most limiting factor to the biological response can be modelled from the observed potential limiting factors. The BLA version 1.0.1 for the R platform has been published on CRAN and is available for download.
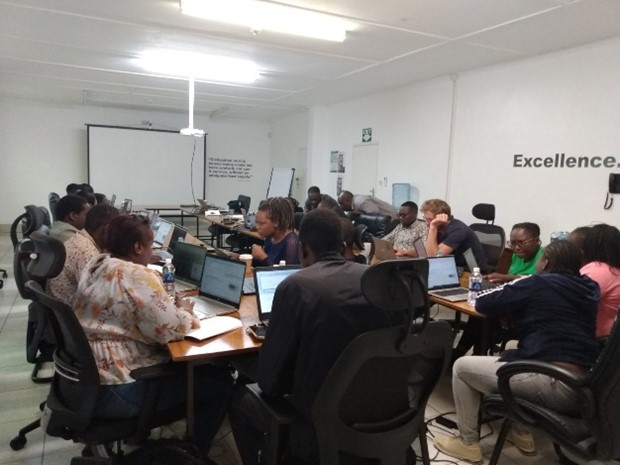
This tool has been developed in consultation with potential users at Consortium of International Agricultural Research Centers (CGIAR) centres (CIMMYT, IITA). Workshops attended by CGIAR researchers in Nairobi and Harare in 2023 provided valuable feedback on the BLA library and the methods which it encodes, which was incorporated into the published package to enhance its functionality and user experience.


Figure 2 : Boundary line methods stakeholder workshops in Nairobi and Harare
By providing a practical tool for implementing boundary line analysis, the BLA R package represents a significant advancement in agricultural research. It promises to play a pivotal role in closing the yield gap by enabling researchers with better understanding and optimisation of crop yield potentials under real-world conditions. For more information about the BLA package visit the website https://chawezimiti.github.io/BLA/ .
References and further links
[1] https://doi.org/10.1016/j.fcr.2012.10.007
[2] https://doi.org/10.1080/00221589.1972.11514472.
No comments yet, fill out a comment to be the first


Leave a Reply