February 11, 2019, by Blue-Green team
The Urban Water Detective – Where is the Water Flowing?
In this blog Stephen Birkinshaw (Newcastle University) discusses flood inundation and urban water modelling.
As part of the Urban Flood Resilience project, I have been carrying out modelling using the CityCat urban flood model. The model produces space-time maps of flood depths and flow pathways. But it is important not to just model in isolation, there is a need to understand what is really happening on the ground.
For most areas of the UK there are accurate and fine resolution surface elevation data (from LiDAR) together with OS MasterMap data which provides buildings and green area data. But the subsurface data is much harder to obtain and less accurate. Ideally there would be perfect information on the location and sizes of all the sewers and all the culverted rivers. But often this information is not available so it takes a bit of detective work to find out what is happening.
Granton Ponds, Edinburgh
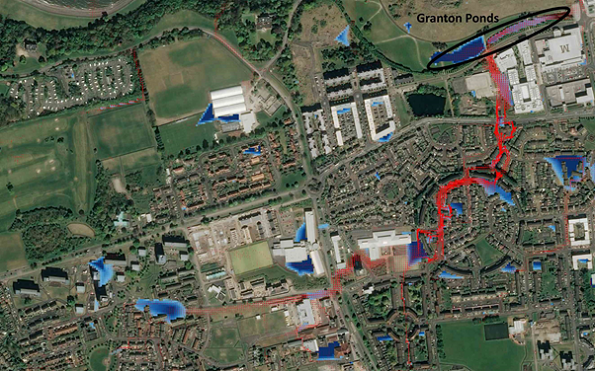
An example of this sort of detective work can be considered for the Granton Ponds in Edinburgh. These ponds have been constructed to help reduce urban flooding that has been exacerbated by the expansion of impervious area. Before visiting the site, I carried out a CityCat simulation for a short duration extreme event for the area around the ponds. In Figure 1, the Granton Ponds are located near the north east, increased water depths are shown as darker blue and the red arrows indicate flow velocity. Water from a catchment area of around 0.9km2 drains into and through the eastern pond.
On 23rd November 2018 I visited the site with Vladimir Krivtsov (Heriot-Watt University). Site visits are really important to understand what is happening and together we carried out an in-depth observational assessment to ground-truth the remote sensing information and the initial understanding of the CityCat results. Water quality measurements were being carried out in the western pond and this pond (Figure 2) has good water quality. It was clear the ‘eastern pond’ has a much higher flow rate, and is actually more like a wetland than a pond and it seemed much more polluted. Around both ponds it was nicely landscaped and it was great to see this Sustainable Urban Drainage feature within the urban environment.
Figure 1 CityCat Simulation of the Granton Ponds for a short duration extreme event. Water depths are shown in blue and velocity vectors in red (© Google maps)
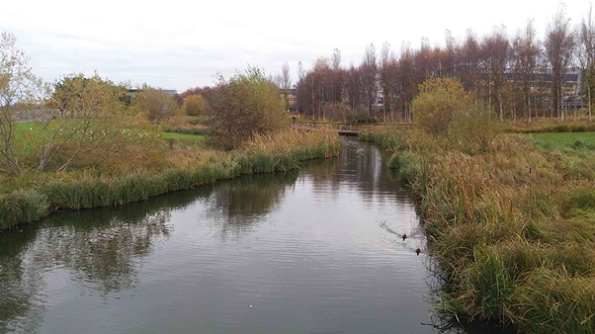
Figure 2 Granton Western Pond, Edinburgh
What was not clear was where the water draining into the ponds came from or even when the ponds were built. A quick search found some details of the scheme. It says that “Caroline Burn, a culverted water course, which crosses the site eventually draining into the estuary, is redirected to emerge as a water feature at the centre of the park to run westward [sic] along the park to an outflow embedded at the edge of the new square”.
I then found more information by looking at two of my favourite resources.
Google Earth
Firstly, historical aerial images from Google Earth. Figure 3 shows three images. In 2003 only the eastern pond was built. With the inflow from the culverted Caroline Burn visible at the western edge of this pond. By 2005 the western pond had also been built and by 2016 the whole area had been nicely landscaped. The pond on the south-west corner of these images is an old quarry, which was also turned into a haven for wildlife.
Historical and aerial maps
Secondly, georeferenced historical and aerial maps that can be seen next to each other on the National Library of Scotland website. From the OS Six Inch 1988-1913 map (Figure 4) it is possible to see some of the course of the Caroline Burn (which I have highlighted). From the 1937-1961 map some of the course can still be seen but much of the burn has been culverted under a housing estate and also the gas works. The redirected burn can be seen as the dashed red line on the recent aerial image. What is interesting is how the course of the culverted burn is followed very closely by the CityCat flow paths (Figure 1). This regularly happens in CityCat simulations in urban catchments. Unfortunately this still leaves some questions.
Q. How much flow can Caroline Burn take before flooding and mow much rainfall is needed to make it flood?
Q. What is the source of water to the western Granton Pond?
It appears to be surface water drainage from the new housing estate to the south and west of the pond. But we really need a sewer map to find out.
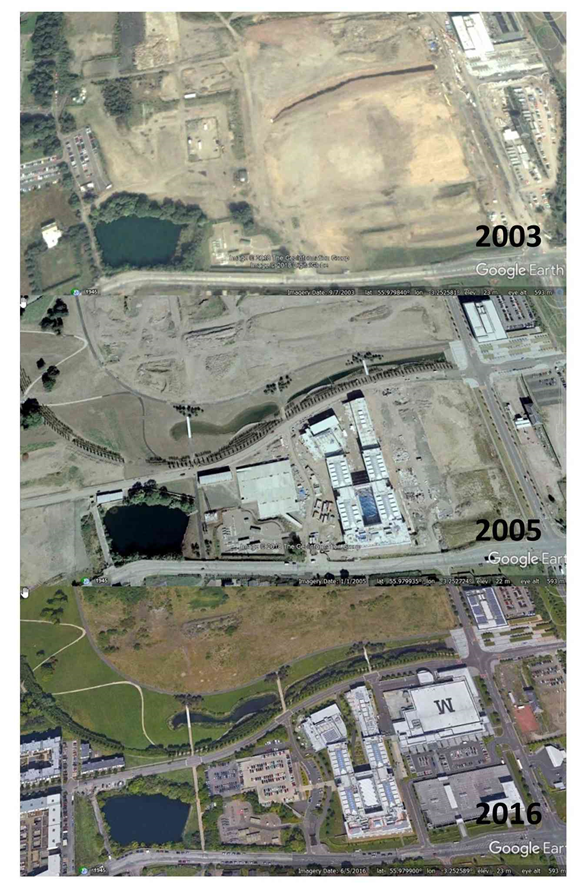
Figure 3 Google Earth Aerial images of the Granton Ponds

Figure 4 Old OS maps and an aerial image from maps.nls.uk. Maps are overlaid with the course of the Caroline Burn.
A final interesting fact is that water from Caroline or Granton Burn was stored in a pond behind Caroline Park and used to supply water to a factory to make ice (the most modern of its kind in 1952) for the fishing industries.
Detective work is required to understand flood issues in urban areas. Historical maps and documents provide a wealth of information on the evolution of the urban environment. This enables better flood risk estimation, benefitting communities.
Learn more about Steve’s research in WP1 and WP2, Urban Flood Resilience research project.
No comments yet, fill out a comment to be the first
Leave a Reply