October 2, 2018, by Blue-Green team
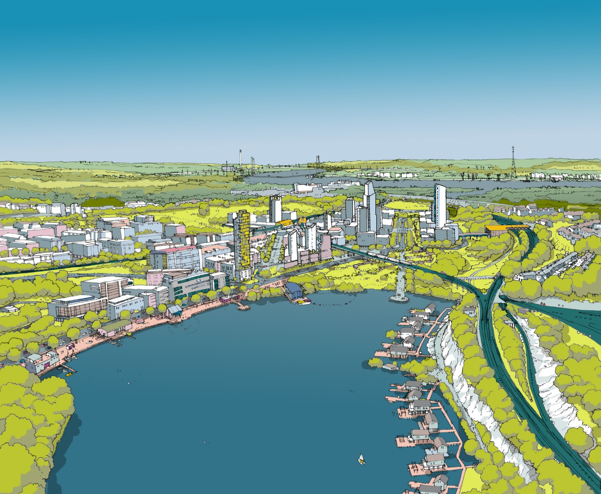
Using System Dynamics for Sustainable Water Management in Ebbsfleet: Part 3
This blog continues from Part 2 and presents a preliminary causal loop diagram created by the research team using the metrics and variables identified by the stakeholders in the last three workshops. It should be stressed that this is an iterative process. This will be presented to the stakeholders, whom will reiterate it over the next few workshops. The preliminary causal loop developed by the research team is meant to streamline the process, but the stakeholders will have the final say over its content.
Visualisation of the variables and metrics
We first visualised all the variables and metrics that were identified by the stakeholders (Part 1). It is clear that there are too many variables which would have made the model too complex to be useful (Figure 1). Furthermore, some of the variables could not be measured, which is important for subsequent modelling.
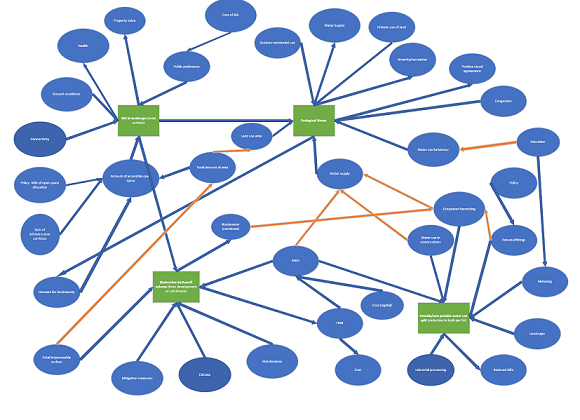
Figure 1. The first visualisation of the variables and metrics; too complex and too many
Glossary of variables
The next step was to produce a glossary of variables. This identified which variables could be cut (due to repetition, inability to measure, or tangential to the key issues), which needed renaming, and which would require further clarification from the stakeholders. This is illustrated in Figure 2, where red variables are ones that could be cut and yellow are ones that required stakeholder input. A reduced glossary of variables was then produced (Figure 3).
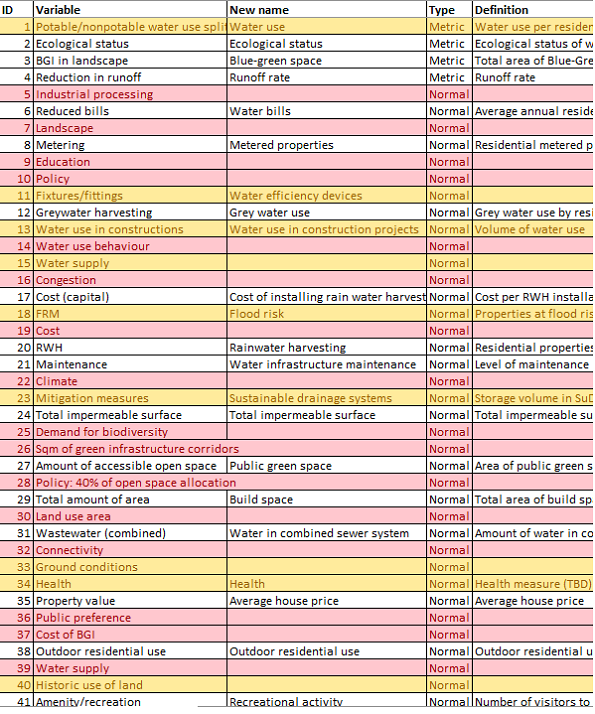
Figure 2. Modelling variables, their names, type and a definition (red variables could be cut and yellow require stakeholder input)
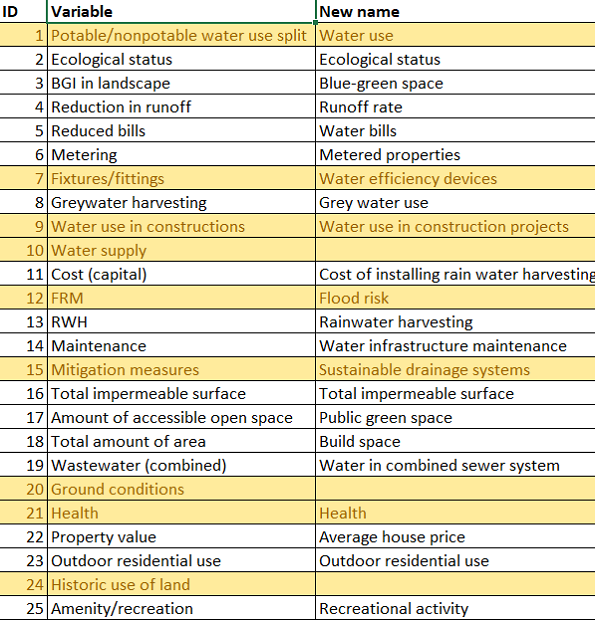
Figure 3. A streamlined set of variables (yellow variables require stakeholder input)
Preliminary causal loop diagram
The next step was to produce the first iteration of the preliminary causal loop diagram. This is a way of organising the variables using cause and effect, so the arrows in the diagram will always go from a cause to its effects. The arrows also show a polarity; a positive [+] sign means as a variable increases it causes another to increase; a negative [-] sign means as a variable increases it causes another to decrease (Figure 4). The first iteration of the causal loop diagram was done on a white board using variables written on cards (Figure 5).
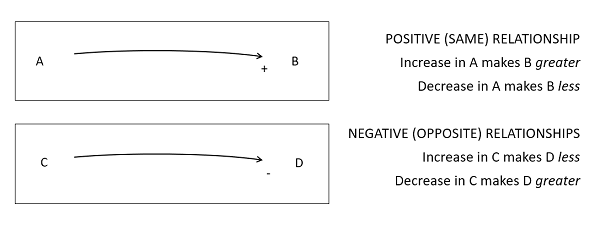
Figure 4. Explaining positive and negative relationships in causal loop diagrams
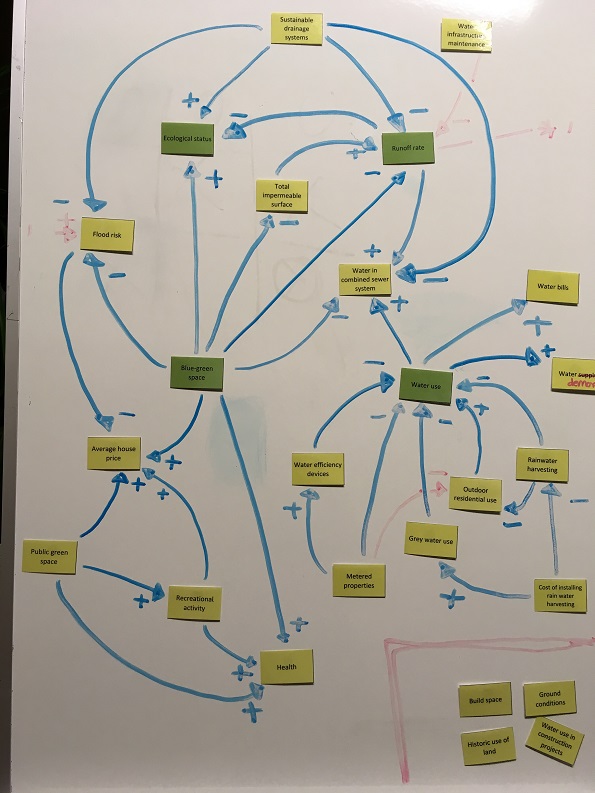
Figure 5. Preliminary causal loop diagram
The causal loop diagram was then produced in Vensim (simulation software) (Figure 6). This will be presented to the stakeholders at the next workshop (October 2018). They will need to assess the diagram and make changes accordingly. For example, they will assess the plausibility of the causal relationships in Ebbsfleet (given their advanced local knowledge) and change them appropriately. They will be asked to add and remove variables, alter causal relationships and polarities, add variable definitions, and define units of measurement. The stakeholders will also need to decide whether to include four additional variables (build space, ground conditions, historic use of land, water use in construction projects) and the problem dimension BIODIVERSITY (a consensus has not yet been reached regarding this dimension).
This process will be finalised when the stakeholders are positive that the causal loop diagram captures real world processes at play in Ebbsfleet as accurately as possible (keeping in mind that, as with any research method, 100% representation of complex, interdependent phenomena is never possible; see our blog about ‘wicked problems’).
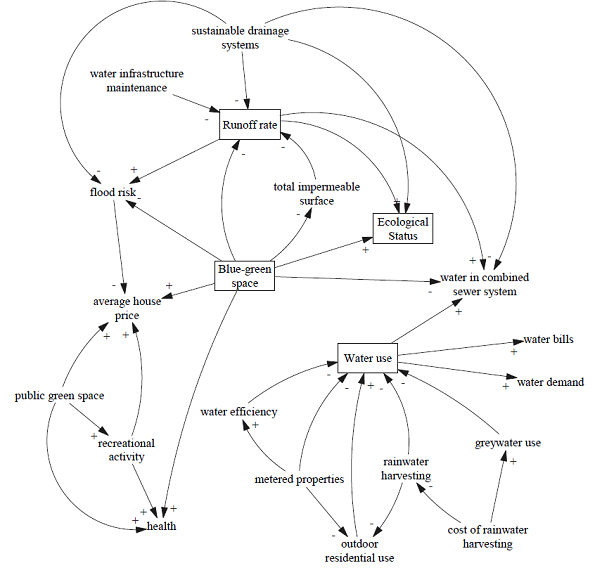
Figure 6. Causal loop diagram produced by Vensim software
This blog was a collaborative effort by members of the Urban Flood Resilience team. For more information on the Ebbsfleet LAA contact Tudor Vilcan.
No comments yet, fill out a comment to be the first
Leave a Reply